Print Files: A4 Size.
Laboratory testing of blood and urine are a standard part of your Gerson physician's follow-up protocol for Gerson Therapy patients. The following compendium of explanations and interpretations is provided to help people feel less intimidated by unfamiliar terms, and to acquaint them with current knowledge.
Either Gould's Medical Dictionary or Taber's Cyclopedic Medical Dictionary will prove an indispensable aid. Also valuable will be the Webster's Unabridged International Dictionary (published by Merriam Co.).
One of the first realizations the reader will have is that lab values shift frequently, rapidly, and for a wide variety of reasons. Even large shifts which fall within or close to normal indicated limits should not be cause for alarm. Results of a single set of chemistries or counts are never conclusive. Remarkable results, those which fall far outside of normal limits, warrant retesting and future monitoring.
The following laboratory test report is an example taken from the chart of a Gerson patient. Headings below are number-referenced to this report. Please note that no two laboratories use the same forms or necessarily group tests in the same way. Although most labs are now using standardized reporting systems, some labs will use ranges of findings which differ from those below.
RESULTS ARE FLAGGED IN ACCORDANCE WITH AGE DEPENDENT REFERENCE RANGES WHICH ARE SUMMARIZED ON THE BACK OF THIS REPORT.
A comment applied to this test has been printed in the body of the report.
This test measures serum levels of calcium, a predominantly extracellular cation that helps regulate and promote neuromuscular and enzyme activity, skele- tal development, and blood coagulation. The body absorbs calcium from the gastrointestinal tract, provided sufficient vitamin D is present, and excretes it in the urine and feces. Over 98% of the body's calcium can shift in and out of these structures. For example, when calcium concentrations in the blood fall below normal, calcium ions can move out of the bones and teeth to help restore blood levels.
Parathyroid hormone, vitamin D, and to a lesser extent, calcitonin and adrenal steroids control calcium blood levels. Calcium and phosphorus are closely related, usually reacting together to form insoluble calcium phosphate. To prevent formation of a precipitate in the blood, calcium levels vary inversely with phosphorus; as serum calcium levels rise, phosphorus levels should decrease through renal excretion. Since the body excretes calcium daily, regular ingestion of calcium in food (at least 1 g/day) is necessary for normal calcium balance.
To aid diagnosis of neuromuscular, skeletal, and endocrine disorders; arrhythmias; blood-clotting deficiencies; and acid-base imbalance.
Normally, serum calcium levels range from 8.9 to 10.1 mg/dl (atomic absorption; 2.25 to 2.75 mmol/L). In children, serum calcium levels are higher than in adults. Calcium levels can rise as high as 12 mg/dl (3.0 mmol/L) during phases of rapid bone growth.
Abnormally high serum calcium levels (hypercalcemia) may occur in hyperparathyroidism and parathyroid tumors (caused by oversecretion of parathyroid hormone), Paget's disease of the bone, multiple myeloma, metastatic carcinoma, multiple fractures, or prolonged immobilization. Elevated serum calcium levels may also result from inadequate excretion of calcium, as in adrenal insufficiency and renal disease; from excessive calcium ingestion; or from overuse of antacids such as calcium carbonate.
Low calcium levels (hypocalcemia) may result from hypoparathyroidism, total parathyroidectomy, or malabsorption. Decreased serum levels of calcium may follow calcium loss in Cushing's syndrome, renal failure, acute pancreatitis, and peritonitis.
Clinical Alert: Observe the patient with hypercalcemia for deep bone pain, flank pain caused by renal calculi, and muscle hypotonicity. Hypercalcemic crisis begins with nausea, vomiting, and dehydration, leading to stupor and coma, and can end in cardiac arrest.
In a patient with hypocalcemia, be alert for circumoral and peripheral numbness and tingling, muscle twitching, Chvostek's sign (facial muscle spasm), tetany, muscle cramping. Trousseau's sign (carpopedal spasm), seizures, and arrhythmias.
This test measures serum levels of phosphates, the dominant cellular anions. Phosphates help store and utilize body energy, and help regulate calcium levels, carbohydrate and lipid metabolism, and acid-base balance. Phosphates are essential to bone for- mation; about 85% of the body's phosphates are found in bone. The intestine absorbs a considerable amount of phosphates from dietary sources, but adequate levels of vitamin D are necessary for their absorption. The kidneys excrete phosphates and serve as a regulatory mechanism. Because calcium and phosphate interact in a reciprocal relationship, urinary excretion of phosphates increases or decreases in inverse proportion to serum calcium levels. Abnormal concentrations of phosphates result more often from improper excretion than from abnormal ingestion or absorption from dietary sources.
Normally, serum phosphate levels range from 2.5 to 4.5 mg/dl (0.80 to 1.40 mmol/L) or from 1.8 to 2.6 mEq/liter. Children have higher serum phosphate levels than adults. Phosphate levels can rise as high as 7 mg/dl (2.25 mmol/L) during periods of increased bone growth.
Because serum phosphate values alone are of limited use diagnostically (only a few rare conditions directly affect phosphate metabolism), they should be interpreted in light of serum calcium results.
Depressed phosphate levels (hypophosphatemia) may result from malnutrition, malabsorption syndromes, hyperparathyroidism, renal tubular acidosis, or treatment of diabetic acidosis. In children, hypophosphatemia can suppress normal growth.
Elevated levels (hyperphosphatemia) may result from skeletal disease, healing fractures, hypoparathyroidism, acromegaly, diabetic acidosis, high intestinal obstruction, and renal failure. Hyperphosphatemia is rarely clinically significant; however, if prolonged, it can alter bone metabolism by causing abnormal calcium phosphate deposits.
This test measures serum levels of sodium, the major extracellular cation. Sodium affects body water distribution, maintains osmotic pressure of extracellular fluid, and helps promote neuromuscular function; it also helps maintain acid-base balance and influences chloride and potassium levels. Sodium is absorbed by the intestines and is excreted primarily by the kidneys; a small amount is lost through the skin.
Since extracellular sodium concentration helps the kidneys to regulate body water (decreased sodium levels promote water excretion and increased levels promote retention), serum levels of sodium are evaluated in relation to the amount of water in the body. For example, a sodium deficit (hyponatremia) refers to a decreased level of sodium in relation to the body's water level. The body normally regulates this sodium-water balance through aldosterone, which inhibits sodium excretion and promotes its resorption (with water) by the renal tubules, to maintain balance. Low sodium levels stimulate aldosterone secretion; elevated sodium levels depress aldosterone secretion.
Special Note: In the context of the Gerson Therapy, both sodium and chloride levels may occasionally fall below normal limits for the general population. When this occurs, frequent monitoring of electrolytes and continuous clinical observation are warranted. In most cases, sodium spilling is self-limiting. Reduction of edema through elimination of sodium is the goal of sodium restriction and potassium supplementation. The body mechanisms which are accelerated by the Gerson Therapy in order to remove sodium from diseased tissue will not normally cause a severe reduction of serum sodium which is essential for life.
Note: When below normal sodium levels occur, the Gerson physician should be immediately consulted.
Normally serum sodium levels range from 135 to 145 mEq/liter (mmol/L).
Sodium imbalance can result from a loss or gain of sodium, or from a change in water volume. Serum sodium results must be interpreted in light of the patient's state of hydration.
Elevated serum sodium levels (hypernatremia) may be caused by inadequate water intake, water loss in excess of sodium (as in diabetes insipidus, impaired renal function, prolonged hyperventilation, and occasionally, severe vomiting or diarrhea), and sodium retention (as in aldosteronism). Hypernatremia can also result from excessive sodium intake.
Clinical Alert: In a patient with hypernatremia and associated loss of water, observe for signs of thirst, restlessness, dry and sticky mucous membranes, flushed skin, oliguria, and diminished reflexes. However, if increased total body sodium causes water retention, observe for hypertension, dyspnea, and edema.
Abnormally low serum sodium levels (hyponatremia) may result from inadequate sodium intake or excessive sodium loss caused by profuse sweating, gastrointestinal suctioning. diuretic therapy, diarrhea, vomiting, adrenal insufficiency, burns, or chronic renal insufficiency with acidosis. Urine sodium determinations are frequently more sensitive to early changes in sodium balance and should always be evaluated simultaneously with serum sodium findings.
In a patient with hyponatremia, watch for apprehension, lassitude, headache, decreased skin turgor, abdominal cramps, and tremors that may progress to convulsions.
This test, a quantitative analysis, measures serum levels of potassium, the major intracellular cation. Small amounts of potassium may also be found in extracellular fluid. Vital to homeostasis, potassium maintains cellular osmotic equilibrium and helps regulate muscle activity (it's essential in maintaining electrical conduction within the cardiac and skeletal muscles). Potassium also helps regulate enzyme activity and acid-base balance, and influences kidney function. Potassium levels are affected by variations in the secretion of adrenal steroid hormones, and by fluctuations in pH, serum glucose levels, and serum sodium levels. A reciprocal relationship appears to exist between potassium and sodium; a substantial intake of one element causes a corresponding decrease in the other. Although it readily conserves sodium, the body has no efficient method for conserving potassium. Even in potassium depletion, the kidneys continue to excrete potassium; therefore, potassium deficiency can develop rapidly and is quite common.
Since the kidneys excrete nearly all the ingested potassium, a dietary intake of at least 40 mEq/day (mmol/d) is essential. (A normal diet usually includes 60 to 100 mEq [mmol/d] potassium.)
Normally, serum potassium levels range from 3.8 to 5.5 mEq/liter (mmol/L).
Abnormally high serum potassium levels (hyperkalemia) are common in patients with bums, crushing injuries, diabetic ketoacidosis, and myocardial infarction - conditions in which excessive cellular potassium enters the blood. Hyperkalemia may also indicate reduced sodium excretion, possibly because of renal failure (preventing normal sodium-potassium exchange) or Addison's disease (caused by the absence of aldosterone, with consequent potassium buildup and sodium depletion).
Note: Although elevated serum potassium is uncommon in Gerson patients, if it does occur, supple-mental potassium should be discontinued and the Gerson physician should be immediately consulted.
Clinical Alert: Observe a patient with hyperkalemia for weakness, malaise, nausea, diarrhea, colicky pain, muscle irritability progressing to flaccid paralysis, oliguria, and bradycardia. Electrocardiogram (ECG) reveals a prolonged PR interval; wide QRS; tall, tented T wave; and ST depression.
Below-normal potassium values often result from aldosteronism or Cushing's syndrome (marked by hypersecretion of adrenal steroid hormones), loss of body fluids (as in long-term diuretic therapy), or excessive licorice ingestion (because of the aldosterone-like effect of glycyrrhizic acid). Although serum values and clinical symptoms can indicate a potassium imbalance, an ECG provides the definitive diagnosis.
Clinical Alert (2): Observe a patient with hypokalemia for decreased reflexes; rapid, weak, irregular pulse; mental confusion; hypotension; anorexia; muscle weakness; and paresthesia. ECG shows a flattened T wave, ST depression, and U wave elevation. In severe cases. ventricular fibrillation, respiratory paralysis, and cardiac arrest can develop.
Excessive or rapid potassium infusion, spironolactone or penicillin G potassium therapy, or renal toxicity from administration of amphotericin B, methicillin, or tetracycline increases serum potassium levels.
Insulin and glucose administration, diuretic therapy (especially with thiazides, but not with triamterene, amiloride, or spironolactone), or I.V. infusions without potassium decrease serum potassium levels.
Excessive hemolysis of the sample or delay in drawing blood folloWing application of a tourniquet increases potassium levels.
This test, a quantitative analysis, measures serum levels of chloride, the major extracellular fluid anion. Interacting with sodium, chloride helps maintain the osmotic pressure of blood and therefore helps regulate blood volume and arterial pressure. Chloride levels also affect acid-base balance. Serum concentrations of this electrolyte are regulated by aldosterone secondarily to regulation of sodium. Chloride is absorbed from the intestines and is excreted primarily by the kidneys.
Normally serum chloride levels range from 100 to 108 mEq/liter (mmol/L).
Chloride levels relate inversely to those of bicarbonate and thus reflect acid-base balance. Excessive loss of gastric juices or of other secretions containing chloride may cause hypochloremic metabolic alkalosis; excessive chloride retention or ingestion may lead to hyperchloremic metabolic acidosis.
Elevated serum chloride levels (hypercloremia) may result from severe dehydration, complete renal shutdown, head injury (producing neurogenic hyperventilation), and primary aldosteronism.
Low chloride levels (hypochloremia) are usually associated with low sodium and potassium levels. Possible underlying causes include prolonged vomiting, gastric suctioning, intestinal fistula, chronic renal failure, and Addison's disease. Congestive heart failure, or edema resulting in excess extracellular fluid can cause dilutional hypochloremia.
Note: If below normal chloride levels occur, the Gerson physician should be immediately consulted.
Clinical Alert: Observe a patient with hypochloremia for hypertonicity of muscles, tetany, and depressed respirations. In a patient with hyperchloremia, be alert for signs of developing stupor, rapid deep breathing, and weakness that may lead to coma.
Lactic dehydrogenase (LDH) is an enzyme that catalyzes the reversible conversion of muscle pyruvic acid into lactic acid. Because LDH is present in almost all body tissues, cellular damage causes an elevation of total serum LDH, thus limiting the diagnostic usefulness of LDH. However, five tissue specific isoenzymes can be identified and measured, using heat inactivation or electrophoresis: two of these isoenzymes, LDH(1) and LDH(2), appear primarily in the heart, red blood cells, and kidneys; LDH(3), primarily in the lungs; and LDH(4) and LDH(5), in the liver and the skeletal muscles.
The specificity of LDH isoenzymes and their distribution pattern is useful in diagnosing hepatic, pulmonary, and erythrocytic damage. But its widest clinical application (with other cardiac enzyme tests) is in diagnosing acute myocardial infarction (MI). LDH isoenzyme assay is also useful when creatine phosphokinase (CPK) hasn't been measured within 24 hours of an acute MI. The myocardial LDH level rises later than CPK (12 to 48 hours after infarction begins), peaks in 2 to 5 days, and drops to normal in 7 to 10 days, if tissue necrosis doesn't persist.
Total LDH levels normally range from 48 to 115 U/L. Normal distribution is as follows -
LDH(1): 17.5% to 28.3% of total
LDH(2): 30.4% to 36.4% of total
LDH(3): 19.2% to 24.8% of total
LDH(4): 9.6% to 15.6% of total
LDH(5): 5.5% to 12.7% of total
Since many common diseases cause elevations in total LDH levels, isoenzyme electrophoresis is usually necessary for diagnosis. In some disorders, total LDH may be within normal limits, but abnormal proportions of each enzyme indicate specific organ tissue damage. For instance, in acute MI, the concentration of LDH(1) is greater than LDH(2) within 12 to 48 hours after onset of symptoms. This reversal of normal isoenzyme patterns is typical of myocardial damage and is referred to as flipped LDH.
(Aspartate transaminase, serum: glutamic-oxaloacetic transaminase, serum)
Aspartate aminotransferase (AST), is one of two enzymes that catalyze the transfer of the nitrogenous portion of amino acid to an amino acid residue. AST is found in the cytoplasm and mitochondria of many cells, primarily in the liver, heart, skeletal muscles, kidneys, pancreas, and to a lesser extent, in red blood cells. It is released into serum in proportion to cellular damage.
Although a high correlation exists between myocardial infarction (MI) and elevated AST, this test is sometimes considered superfluous for diagnosing MI because of its relatively low organ specificity; it doesn't enable differentiation between acute MI and the effects of hepatic congestion due to heart failure.
AST levels by a commonly used method range from 8 to 20 U/L. Normal values for infants are as high as four times those of adults.
AST levels fluctuate in response to the extent of cellular necrosis and therefore may be transiently and minimally elevated early in the disease process, and extremely elevated during the most acute phase. Depending on when the initial sample was drawn, AST levels can rise - indicating increasing disease severity and tissue damage - or fall - indicating disease resolution and tissue repair. Thus, the relative change in AST values serves as a reliable monitoring mechanism.
Maximum elevations are associated with certain diseases and conditions. For example, very high elevations (more than 20 times normal) may indicate acute viral hepatitis, severe skeletal muscle trauma, extensive surgery, drug-induced hepatic injury, and severe passive liver congestion.
High levels: (ranging from 10 to 20 times normal) may indicate severe myocardial infarction, severe infectious mononucleosis, and alcoholic cirrhosis. High levels may also occur during the prodromal or resolving stages of conditions that cause maximal elevations.
Moderate-to-high levels: (ranging from 5 to 10 times normal) may indicate Duchennne muscular dystrophy, dermatomyositis, and chronic hepatitis. Moderate-to-high levels also occur during prodromal and resolving stages of diseases that cause high elevations.
Low-to-moderate levels: (ranging from 2 to 5 times normal) may indicate hemolytic anemia, metastatic hepatic tumors, acute pancreatitis, pulmonary emboli, alcohol withdrawal syndrome, and fatty liver. AST levels rise slightly after the first few days of biliary duct obstruction. Also, low-to-moderate elevations occur at some time during any of the preceding conditions or diseases.
This test measures serum levels of bilirubin, the predominant pigment in bile. Bilirubin is the major product of hemoglobin catabolism. After being formed in the reticuloendothelial cells, bilirubin is bound to albumin and is transported to the liver, where it is conjugated with glucuronic acid to form bilirubin glucuronide and bilirubin diglucuronide - compounds that are then excreted in bile.
Effective conjugation and excretion of bilirubin depends on a properly functioning hepatobiliary system and a normal red blood cell turnover rate. Therefore, measurement of unconjugated (indirect or prehepatic) bilirubin, and conjugated (direct or posthepatic) bilirubin can help evaluate hepatobiliary and erythropoietic functions. Serum bilirubin measurements are especially significant in neonates because elevated unconjugated bilirubin can accumulate in the brain (kernicterus) and cause irreparable tissue damage.
Elevated indirect serum bilirubin levels often indicate hepatic damage in which the parenchymal calls can no longer conjugate bilirubin with glucuronide. Consequently, indirect bilirubin reenters the bloodstream. High levels of indirect bilirubin are also likely in severe hemolytic anemia, when excessive indirect bilirubin overwhelms the liver's conjugating mechanism. If hemolysis continues, both direct and indirect bilirubin may rise.
Normally in an adult, indirect serum bilirubin measures 1.1 mg/dl or less; direct serum bilirubin, less than 0.5 mg/dl. Total serum bilirubin in neonates ranges from 1 to 12 mg/dl.
Elevated serum levels of indirect bilirubin indicate hemolysis (for example in G-6PD deficiency, autoimmunity, or transfusion reaction); hemolytic or pernicious anemia or hemorrhage; hepato-cellular dysfunction (possibly resulting from viral hepatitis or congenital enzyme deficiencies, such as Gilbert's disease and Crigler-Najjar syndrome); or neonatal hepatic immaturity.
Elevated levels of direct conjugated bilirubin usually indicate biliary obstruction, in which direct bilirubin, blocked from its normal pathway from the liver into the biliary tree, overflows into the bloodstream. Biliary obstruction may be intrahepatic (viral hepatitis, cirrhosis, chlorpromazine reaction), extrahepatic (gallstones, gallbladder or pancreatic carcinoma), or result from bile duct disease. If biliary obstruction continues, both direct and indirect bilirubin may be eventually elevated because of hepatic damage. In severe chronic hepatic damage, direct bilirubin concentrations may return to normal or near-normal levels, but elevated indirect bilirubin levels persist.
In neonates, total bilirubin levels that reach or exceed 20 mg/dl indicate the need for exchange transfusion.
Gamma-glutamyl transpeptidase (GGT) is most commonly elevated in hepatobiliary disease. This enzyme is very sensitive to drug induction and, therefore, is often used to detect recent alcohol ingestion, which is important in determining compliance with treatment of alcoholism. GGT is more sensitive than alkaline phosphatase in predicting cholestatic processes and neoplastic liver disease. However, its sensitivity to induction by drugs is problematic in regard to specificity.
The normal range for GGT varies considerably with age in males but is not affected in females. The normal range in males between ages 18 to 50 is 10 to 39 U/L. In older males, it ranges from 10 to 48 U/L. The normal range in females is 6 to 29 U/L. Usually, elevated GGT levels signal a cholestatic liver process. Alternatively, elevated GGT levels occur within 24 hours of significant alcohol ingestion. When both alkaline phosphatase and GGT levels are elevated, the source of the alkaline phosphatase is most likely the liver. Note: GGT frequently rises above normal levels in response to the immune-stimulating effect of the Gerson Therapy.
Acid phosphatase, a group of phosphatase enzymes most active at a pH of about 5.0, appears primarily in the prostate gland and semen, and to a lesser extent, in the liver, spleen, red blood cells, bone marrow, and platelets.
Prostatic and erythrocytic enzymes are this group's two major isoenzymes; the prostatic isoenzyme is more specific for prostatic cancer. The more widespread the tumor, the more likely it is to produce high serum acid phosphatase levels. The acid phosphatase assay is usually restricted to adult males to detect prostatic cancer.
This test measures total acid phosphatase and the prostatic fraction in serum by radioimmunoassay or biochemical enzyme assay.
To detect prostatic cancer and to monitor response to therapy for prostatic cancer; successful treatment decreases acid phosphatase levels.
Serum values for total acid phosphatase range from 0 to 1.1 Bodansky units/ml; 1 to 4 King Armstrong units/ml; 0.13 to 0.63 Bessey-Lowery-Brock (BLB) units/ml; and 0 to 6 U/L in SI units, common to all these methods. Normal range of radioimmunoassay results is 0 to 4.0 ng/ml.
Generally, high prostatic acid phosphatase levels indicate a tumor that has spread beyond the prostatic capsule. If the tumor has metastasized to bone, high acid phosphatase levels are accompanied by high alkaline phosphatase levels, reflecting increased osteoblastic activity.
Misleading results may occur if alkaline phosphatase levels are high, because acid and alkaline phosphatase enzymes are very similar and differ mainly in the optimum pH ranges. Some alkaline phosphatase may react at a lower pH and thus be detected as acid phosphatase. Acid phosphatase levels rise moderately in prostatic infarction, Paget's disease (some patients), Gaucher's disease, and occasionally, in other conditions, such as multiple myeloma.
(Alanine transaminase, serum; glutamic-pyruvic transaminase, serum)
Alanine aminotransferase (ALT), one of the two enzymes that catalyzes a reversible amino group transfer reaction in the Krebs cycle (citric acid or tricarboxylic acid cycle), is necessary for tissue energy production. Unlike aspartate aminotransferase, the other aminotransferase, ALT primarily appears in hepatocellular cytoplasm, with lesser amounts in the kidneys, heart, and skeletal muscles, and is a relatively specific indicator of acute hepatocellular damage. When such damage occurs, ALT is released from the cytoplasm into the bloodstream, often before jaundice appears, resulting in abnormally high serum levels that may not return to normal for days or weeks. This test measures serum ALT levels, using the spectrophotometric or the colorimetric method.
ALT levels by a commonly used method range from 10 to 32 U/L; in women, from 9 to 24 U/L. The normal range for infants is twice that of adults.
Very high ALT levels: (up to 50 times normal) suggest viral or severe drug-induced hepatitis, or other hepatic disease with extensive necrosis. (AST levels are also elevated but usually to a lesser degree.)
Moderate-to-high levels: may indicate infectious mononucleosis, chronic hepatitis, intrahepatic cholestasis or cholecystitis, early or improving acute viral hepatitis, or severe hepatic congestion due to heart failure.
Slight-to-moderate elevations of ALT: (usually with higher increases in AST levels) may appear in any condition that produces acute hepatocellular injury - such as active cirrhosis, and drug-induced or alcoholic hepatitis.
Marginal elevations: occasionally occur in acute myocardial infarction, reflecting secondary hepatic congestion or the release of small amounts of ALT from myocardial tissue.
Opiate analgesics (morphine, codeine, meperidine) may falsely elevate ALT levels by increasing intrabiliary pressure.
This test measures serum levels of alkaline phosphatase, an enzyme that is most active at about pH 9.0. Alkaline phosphatase influences bone calcification and lipid and metabolite transport. Total serum levels reflect the combined activity of several alkaline phosphatase isoenzymes found in the liver, bones, kidneys, intestinal lining, and placenta. Bone and liver alkaline phosphatase are always present in adult serum, with liver alkaline phosphatase most prominent - except during the third trimester of pregnancy (when the placenta originates about half of all alkaline phosphatase). The intestinal variant of this enzyme can be a normal component (in less than 10% of normal patients; a genetically controlled characteristic found almost exclusively in the sera of blood groups B and O); or it can be an abnormal finding associated with hepatic disease.
The alkaline phosphatase test is particularly sensitive to mild biliary obstruction and is a primary indicator of space-occupying hepatic lesions; additional liver function studies are usually required to identify hepatobiliary disorders. Its most specific clinical application is in the diagnosis of metabolic bone disease.
The normal range of serum alkaline phosphatase varies with the laboratory method used. Total alkaline phosphatase levels range from 30 to 120 U/L in adults; 40 to 200 U/L in children. Since alkaline phosphatase concentrations rise during active bone formation and growth, infants, children, and adolescents normally have high levels that may be three times as high as those of adults. Pregnancy also causes a physiologic rise in alkaline phosphatase levels.
Normal range is from 1.5 to 4 Bodansky units/dl; for the King-Armstrong method, normal adult values range from 4 to 13.5 King-Armstrong units/dl; 0.8 to 2.5 Bessey-Lowry units/dl; and 30 to 110 U/L by SMA 1260.
Significant alkaline phosphatase elevations are most likely to indicate skeletal disease, or extra or intrahepatic biliary obstruction causing cholestasis. Many acute hepatic diseases cause alkaline phosphatase elevations before any change in serum bilirubin levels. Moderate rise in alkaline phosphatase levels may reflect acute biliary obstruction from hepatocellular inflammation in active cirrhosis, mononucleosis, and viral hepatitis. Moderate increases are also seen in osteomalacia and deficiency-induced rickets.
Sharp elevations of alkaline phosphatase levels may result from complete biliary obstruction by malignant or infectious infiltrations or fibrosis. Such markedly high levels are most common in Paget's disease and, occasionally, in biliary obstruction, extensive bone metastases, or hyperparathyroidism. Metastatic bone tumors resulting from pancreatic cancer raise alkaline phosphatase levels without a concomitant rise in AST levels.
Isoenzyme fractionation and additional enzyme tests - serum gamma glutamyl transferase, acid phosphatase, 5'-nucleotidase, and leucine aminopeptidase - are sometimes performed when the cause of alkaline phosphatase elevations (skeletal or hepatic disease) is in doubt. Rarely, low serum alkaline phosphatase levels are associated with hypophosphatasia and protein or magnesium deficiency.
This test, the quantitative analysis of serum cholesterol, measures the circulating levels of free cholesterol and cholesterol esters; it reflects the level of the two forms in which this biochemical compound appears in the body.
Cholesterol, a structural component in cell membranes and plasma lipoproteins, is both absorbed from the diet and synthesized in the liver and other body tissues. It contributes to the formation of adrenocorticoid steroids, bile salts, and androgens and estrogens.
A diet high in saturated fat raises cholesterol levels by stimulating absorption of lipids, including cholesterol, from the intestine; a diet low in saturated fat lowers them. Elevated total serum cholesterol levels are associated with an increased risk ofatherosclerotic cardiovascular disease, particularly coronary artery disease (CAD).
Total cholesterol concentrations vary with age and sex, and commonly range from 150 to 200 mg/dl.
The desirable blood cholesterol level is below 200 mg/dl. cholesterol levels of 200 to 240 mg/dl are considered borderline or at high risk for CAD, depending on other concurrent risk factors. Cholesterol levels that exceed 250 mg/dl indicate high risk of cardiovascular disease and require treatment.
Elevated serum cholesterol (hypercholesterolemia) may indicate incipient hepatitis, lipid disorders, bile duct blockage, nephrotic syndrome, obstructive jaundice, pancreatitis, and hypothyroidism.
Hypercholesterolemia caused by high dietary intake requires modification of eating habits and, possibly, medication to retard absorption of cholesterol.
Low serum cholesterol (hypocholesterolemia) is commonly associated with malnutrition, cellular necrosis of the liver, and hyperthyroidism. Abnormal cholesterol levels frequently necessitate further testing to pinpoint the disorder, depending on the type of abnormality and the presence of overt signs. Abnormal levels associated with cardiovascular diseases, for example, may necessitate lipoprotein phenotyping.
Note: Cholesterol levels often drop below normal levels in Gerson Therapy patients due to the extremely low fat nature of the diet, such results are not clinically significant in this context.
Cholesterol levels are lowered by cholestyramine, clofibrate, colestipol, cholchicine, dextrothyroxine, estrogen, dilantin, glucagon, heparin, kanamycin, haloperidol, neomycin, niacin, nitrates, para-aminosalicylic acid, and chlortetracycline. Levels are raised by adrenocorticotropic hormone, corticosteroids, androgens, bile salts, epinephrine, chlorpromazine, trifluoperazine, oral contraceptives, salicylates, thiouracils, and trimethadione. Androgens may have a variable effect on cholesterol levels. Failure to follow dietary restrictions may interfere with test results.
Cholesterol fractionation tests isolate and measure the cholesterol in serum - low-density lipoproteins (LDL) and high-density lipoproteins (HDL) - by ultra-centrifugation or electrophoresis. The cholesterol in LDL and HDL fractions is significant, since the Framingham Heart Study has shown that cholesterol in HDL is inversely related to the incidence of coronary artery disease (CAD) - the higher the HDL level, the lower the incidence of CAD; conversely, the higher the LDL level, the higher the incidence of CAD.
Note: A minimal amount of fat is essential in the diet and is included in the Gerson Therapy to provide an adequate supply of certain polyunsaturated fatty acids (the essential fatty acids) and of fat-soluble vitamins which cannot be synthesized in adequate amounts for optimal body function. As well as acting as a carrier of these essential compounds, dietary fat is necessary for their efficient absorption from the gastrointestinal tract.
Since normal cholesterol values vary according to age, sex, geographic region, and ethnic group, check the laboratory for normal values. An alternate method (measuring cholesterol and triglyceride levels, and separating out HDL by selective precipitation and using these values to calculate LDL) provides normal HDL-cholesterol levels that range from 29 to 77 mg/100ml and normal LDL-cholesterol levels that range from 62 to 185 mg/100ml.
High LDL levels increase the risk of CAD. Elevated HDL levels generally reflect a healthy state but can also indicate chronic hepatitis, early-stage primary biliary cirrhosis, or alcohol consumption. Rarely, a sharp rise (to as high as 100 mg/dl) in a second type of HDL [alpha(2)-HDL] may signal CAD. Although cholesterol fractionation provides valuable information about the risk of heart disease, other sources of such risk - diabetes mellitus, hypertension, cigarette smoking - are at least as important.
This test provides quantitative analysis of triglycerides - the main storage form of lipids - which constitute about 95% of fatty tissue. Although not in itself diagnostic, serum triglyceride analysis permits early identification of hyperlipemia (characteristic in nephrotic syndrome and other conditions) and the risk of coronary artery disease (CAD).
Triglycerides consist of one molecule of glycerol bonded to three molecules of fatty acids (usually some combination of stearic, oleic, and palmitic). Thus, the degradation of triglycerides is associated with several lipid aggregates, primarily chylomicrons, whose major function is transport of dietary triglycerides. When present in serum, chylomicrons produce a cloudiness that interferes with many laboratory tests.
Triglyceride values are age-related. Some controversy exists over the most appropriate normal ranges, but the following are fairly widely accepted:
| Age | Triglycerides | |
| mg/dl | mmol/L | |
| 0-29 | 10-140 | 0.1-1.55 |
| 30-39 | 10-150 | 0.1-1.65 |
| 40-49 | 10-160 | 0.1-1.75 |
| 50-59 | 10-190 | 0.1-2.10 |
Increased or decreased serum triglyceride levels merely suggest a clinical abnormality, and additional tests are required for definitive diagnosis. For example, measurement of cholesterol may also be necessary, since cholesterol and triglycerides vary independently.
High levels: of triglyceride and cholesterol reflect an exaggerated risk ofatherosclerosis or CAD.
Mild-to-moderate: increase in serum triglyceride levels indicates biliary obstruction, diabetes, nephrotic syndrome, endocrinopathies, or excessive consumption of alcohol. Markedly increased levels without an identifiable cause reflect congenital hyperlipoproteinemia and necessitate lipoprotein phenotyping to confirm diagnosis.
Note: Increased levels are sometimes seen in flare ups and reactions on Gerson Therapy and are of no negative clinical significance.
Decreased serum levels are rare, occurring primarily in malnutrition or abetalipoproteinemia. In the latter, serum is virtually devoid of beta-lipoproteins and triglycerides, because the body lacks the capacity to transport preformed triglycerides from the epithelial cells of the intestinal mucosa or from the liver.
This test measures serum albumin and globulins, the major blood proteins, in an electric field by separating the proteins according to their size, shape, and electric charge at pH 8.6. Because each protein fraction moves at a different rate, this movement separates the fractions into recognizable and measurable patterns.
Albumin, which comprises more than 50% of total serum protein, maintains oncotic pressure (preventing leakage of capillary plasma), and transports substances that are insoluble in water alone, such as bilirubin, fatty acids, hormones, and drugs. Four types of globulins exist - alpha(1), alpha(2), beta, and gamma. The first three types act primarily as carrier proteins that transport lipids, hormones, and metals through the blood. The fourth type, gamma globulin, is an important component in the body's immune system.
Electrophoresis is the most current method for measuring serum proteins. However, determinations of total protein and albumin-globulin (A-G) ratio are still commonly performed. When the relative percent of each component protein fraction is multiplied by the total protein concentration, the proportions can be converted into absolute values. Regardless of test method, however, a single protein fraction is rarely significant by itself. The usual clinical indication for this test is suspected hepatic disease or protein deficiency.
Normal levels range as follows:
| Total serum protein | 6.6-7.9 g/dl |
| Albumin fraction | 3.3-4.5 g/dl |
| Alpha(1)-globulin | 0.1-0.4 g/dl |
| fraction | |
| Alpha(2)-globulin | 0.5-1.0 g/dl |
| Beta globulin | 0.7-1.2 g/dl |
| Gamma globulin | 0.5-1.6 g/dl |
The A-G ratio, the balance between total albumin and total globulin, is usually evaluated in relation to the total protein level. A low total protein and a reversed A-G ratio (decreased albumin and elevated globulins) suggest chronic liver disease. A normal total protein with a reversed A-G ratio suggests myeloproliferative disease (leukemia, Hodgkin's disease) or certain chronic infectious diseases (tuberculosis, chronic hepatitis).
This test measures the nitrogen fraction of urea, the chief end product of protein metabolism. Formed in the liver from ammonia and excreted by the kidneys, urea constitutes 40% to 50% of the blood's non-protein nitrogen. The blood urea nitrogen (BUN) level reflects protein intake and renal excretory capacity, but is a less reliable indicator of uremia than the serum creatinine level. Photometry is a commonly used test method.
To evaluate renal function and aid diagnosis of renal disease and to aid assessment of hydration.
BUN values normally range from 8 to 20 mg/dl.
Elevated BUN levels occur in renal disease, reduced renal blood flow (caused by dehydration, for example), urinary tract obstruction, and in increased protein catabolism (as in burns).
Depressed BUN levels occur in severe hepatic damage, malnutrition, and overhydration.
Note: Due to initial decreased dietary protein intake, the Gerson patient's normal value is slightly under that considered normal for the average person.
A quantitative analysis of serum creatinine levels, this test provides a more sensitive measure of renal damage than blood urea nitrogen levels, because renal impairment is virtually the only cause of creatinine elevation. Creatinine is a nonprotein end product of creatine metabolism. Similar to creatine, creatinine appears in serum in amounts proportional to the body's muscle mass; unlike creatine, it is easily excreted by the kidneys, with minimal or no tubular reabsorption. Creatinine levels, therefore, are directly related to the glomerular filtration rate. Since creatinine levels normally remain constant, elevated levels usually indicate diminished renal function. Determination of serum creatinine is commonly based on the Jaffe reaction.
Creatinine concentrations in males normally range from 0.8 to 1.2 mg/dl; in females from 0.6 to 0.9 mg/dl.
Elevated serum creatinine levels generally indicate renal disease that has seriously damaged 50% or more of the nephrons. Elevated creatinine levels may also be associated with gigantism and acromegaly.
Used primarily to detect gout, this test measures serum levels of uric acid, the major end metabolite of purine. Large amounts of purines are present in nucleic acids and derive from dietary and endogenous sources. Uric acid clears the body by glomerular filtration and tubular secretion. However, uric acid is not very soluble at a pH of 7.4 or lower. Disorders of purine metabolism, rapid destruction of nucleic acids (such as gout), excessive cellular generation and destruction (such as leukemia), and conditions marked by impaired renal excretion (such as renal failure) characteristically raise serum uric acid levels.
To confirm diagnosis of gout and to help detect kidney dysfunction.
Uric acid concentrations in men normally range from 4.3 to 8mg/dl; in women, from 2.3 to 6 mg/dl.
Increased serum uric acid levels may indicate gout, although levels don't correlate with severity of disease or impaired renal function. Levels may also rise in congestive heart failure, glycogen storage disease (type 1, von Gierke's disease), acute infectious diseases (such as infectious mononucleosis), hemolytic or sickle cell anemia, hemoglobinopathies, polycythemia, leukemia, lymphoma, metastatic malignancy, and psoriasis.
Depressed uric acid levels may indicate defective tubular absorption (as in Fanconi's syndrome and Wilson's disease) or acute hepatic atrophy.
Commonly used to screen for disorders of glucose metabolism, mainly diabetes mellitus, the fasting plasma glucose test measures plasma glucose levels following a 12-to 14-hour fast.
In the fasting state, blood glucose levels decrease, stimulating release of the hormone glucagon. Glucagon then acts to raise plasma glucose by accelerating glycogenolysis, stimulating glyconeogenesis, and inhibiting glycogen synthesis. Normally, secretion of insulin checks this rise in glucose levels. In diabetes, however, absence or deficiency of insulin allows persistently high glucose levels.
Normal range for fasting blood glucose varies according to the laboratory procedure. Generally, normal values after an 8 to 12 hour fast are as follows: fasting serum, 70-100 mg/dl; fasting whole blood, 60 to 100 mg/dl; nonfasting, 85 to 125 mg/dl in persons over age 50, and 70 to 115 mg/dl in persons under age 50.
Fasting blood glucose levels of 140 to 150 mg/dl or higher, obtained on two or more occasions may be considered diagnostic of diabetes mellitus if other possible causes of hyperglycemia have been ruled out. Nonfasting levels that exceed 200 mg/dl also suggest diabetes. Although increased fasting blood glucose levels most commonly indicate diabetes, such levels can also result from pancreatitis, hyperthyroidism, and pheochromocytoma. Hyperglycemia may also stem from chronic hepatic disease, brain trauma, chronic illness, or chronic malnutrition, and is typical in eclampsia, anoxia, and convulsive disorders.
Depressed glucose levels can result from hyperinsulinism (overdose of insulin is the most common cause), insulinoma, von Gierke's disease, functional or reactive hypoglycemia, hypothyroidism, adrenal insufficiency, congenital adrenal hyperplasia, hypopituitarism, islet cell carcinoma of the pancreas, hepatic necrosis, and glycogen storage disease.
Iron is essential to the formation and function of hemoglobin, as well as many other heme and non-heme compounds. After iron is absorbed by the intestine, it's distributed to various body compartments for synthesis, storage, and transport. Since iron appears in the plasma, bound to a glycoprotein called transferrin, it is easily sampled and measured. The sample is treated with buffer and color reagents.
Serum iron assay measures the amount of iron bound to transferrin; total iron-binding capacity (TIBC) measures the amount of iron that would appear in plasma if all the transferrin were saturated with iron. The percentage of saturation is obtained by dividing the serum iron result by the TIBC, which reveals the actual amount of saturated transferrin. Normally, transferrin is about 30% saturated.
Serum iron and TIBC are of greater diagnostic usefulness when performed with the serum ferritin assay; together these tests may not accurately reflect the state of other iron compartments, such as myoglobin iron and the labile iron pool. Bone marrow or liver biopsy, and iron absorption or excretion studies may yield more information.
Normal serum iron and TIBC values are as follows:
| Serum iron | TIBC | Saturation |
| mcg/dl | mcg/dl | |
| Men: | ||
| 70-150 | 300-400 | 20% - 50% |
| Women: | ||
| 80-150 | 350-450 | 20% - 50% |
In iron deficiency, serum iron levels drop and TIBC increases to decrease the saturation. In cases of chronic inflammation (such as in rheumatoid arthritis), serum iron may be low in the presence of adequate body stores, but TIBC may be unchanged or may drop to preserve normal saturation. Iron overload may not alter serum levels until relatively late, but in general, serum iron increases and TIBC remains the same to increase the saturation.
This test reports the number of red blood cells (RBCs) found in a microliter (cubic millimeter) of whole blood, and is included in the complete blood count.
Traditionally counted by hand with a hemacytometer, RBCs are now commonly counted with electronic devices, which provide faster, more accurate results. The RBC count itself provides no qualitative information regarding the size, shape, or concentration of hemoglobin within the corpuscles but may be used to calculate two erythrocyte indices: mean corpuscular volume (MCV) and mean corpuscular hemoglobin (MCH).
To supply figures for computing the erythrocyte indices, which reveal RBC size and hemoglobin content.
To support other hematologic tests in diagnosis of anemia and polycythemia.
Normal RBC values vary, depending on age, sex, sample, and geographic location. In adult males, red cell counts range from 4.5 to 6.2 million /microliter (4.5 to 6.2 x 10¹²/L) of venous blood; in adult females, 4.2 to 5.4 million/microliter (4.2 to 5.4 x 10¹²/L) of venous blood; in children, 4.6 to 4.8 million/microliter of venous blood. In full-term infants, values range from 4.4 to 5.8 million/microliter (4.4 to 5.8 x 10¹²/L) of capillary blood at birth; fall to 3 to 3.8 million/microliter (3.0 to 3.8 x 10¹²/L) at age 2 months; and increase slowly thereafter. Values are generally higher in persons living at high altitudes.
An elevated RBC count may indicate primary or secondary polycythemia, or dehydration; a depressed count may indicate anemia, fluid overload, or recent hemorrhage. Further tests, such as stained cell indices, and white cell studies, are needed to confirm diagnosis.
Note: If total bedrest has been ordered, RBC counts may commonly drop considerably due to decreased oxygen requirements.
This test, usually performed as part of a complete blood count, measures the grams of hemoglobin found in a deciliter (100ml) of whole blood. Hemoglobin concentration correlates closely with the red blood cell (RBC) count, and is affected by the hemoglobin-RBC ratio (mean corpuscular hemoglobin [MCH]) and free plasma hemoglobin. In the laboratory, hemoglobin is chemically converted to pigmented compounds and is measured by spectrophotometric or colorimetric technique.
Hemoglobin concentration varies, depending on the patient's age and sex, and on the type of blood sample drawn. Except for infants, values for age groups listed in Normal hemoglobin levels are based on venous blood samples.
| Age | Hemoglobin level |
| Less than 7 days | 17 to 22 g/dl |
| 1 week | 15 to 20 g/dl |
| 1 month | 11 to 15 g/dl |
| Children | 11 to 13 g/dl |
| Adult males | 14 to 18 g/dl |
| Elderly males | 12.4 to 14.9 g/dl |
| Adult females | 12 to 16 g/dl |
| Elderly females | 11.7 to 13.8 g/dl |
Hematocrit (Hct) measures the percentage by volume of packed red blood cells (RBCs) in a whole blood sample; for example, an Hct of 40% (0.40) means that a 100 ml sample contains 40 ml of packed RBCs. This packing is achieved by cetrifugation of anticoagulated whole blood in a capillary tube, so that red cells are tightly packed without hemolysis. Hct depends mainly on the number of RBCs, but is also influenced by the average size of the RBC. For example, conditions such as elevated concentrations of blood glucose and sodium, which cause swelling of erythrocytes may produce elevated hematocrits.
Test results may be used to calculate two erythrocyte indices: mean corpuscular volume (MCV) and mean corpuscular hemoglobin concentration (MCHC).
Hct values vary, depending on the patient's sex and age, type of sample, and the laboratory performing the test. Reference values range from 40% to 54% (0.40 to 0.54) for men, and 37% to 47% (0.37 to 0.47) for women.
Low Hct may indicate anemia or hemodilution; high Hct suggests polycythemia or hemoconcentration caused by blood loss.
Note: Post-test care. If a hematoma develops at the venipuncture sites, applying ice, followed later by warm soaks, eases discomfort.
Using the results of the red blood cell (RBC) count, hematocrit. and total hemoglobin tests, the red cell indices provide important information about the size, hemoglobin concentration, and hemoglobin weight of an average red cell. The indices include mean corpuscular volume (MCV), mean corpuscular hemoglobin (MCH), and mean corpuscular hemoglobin concentration (MCHC).
MCV, the ratio of hematocrit (packed cell volume) to the RBC count, expresses the average size of the erythrocytes and indicates whether they are undersized (microcytic), oversized (macrocytic), or normal (normocytic). MCH, the hemoglobin-REC ratio, gives the weight of hemoglobin in an average red cell. MCHC, the ratio of hemoglobin weight to hematocrit, defines the concentration of hemoglobin in 100 ml of packed red cells. It helps distinguish normally colored (normochromic) red cells from paler (hypochromic) red cells.
The range of normal red cell indices is as follows:
MCV: 84 to 99 microliters3/red cell (fL/red cell)
MCHC: 30% to 36% (300 to 360 g/L)
The red cell indices aid in classification of anemias. Low MCV and MCHC indicate microcytic, hypochromic anemias caused by iron deficiency anemia, pyridoxine-responsive anemia, and thalassemia. A high MCV suggests macrocytic anemias caused by megaloblastic anemias, caused by folic acid or vitamin B-12 deficiency, inherited disorders of DNA synthesis, and reticulocytosis. Because MCV reflects average volume of many cells, a value within normal range can encompass RBCs of varying size, from microcytic to macrocytic.
The erythrocyte sedimentation rate (ESR) measures the time required for erythrocytes in a whole blood sample to settle to the bottom of a vertical tube. As the red cells descend in the tube, they displace an equal volume of plasma upward, which retards the downward progress of other settling blood elements. Factors affecting ESR include red cell volume, surface area, density, aggregation, and surface charge. Plasma proteins (notably fibrinogen and globulin) encourage aggregation, increasing ESR.
The ESR is a sensitive but nonspecific test that is frequently the earliest indicator of disease when other chemical or physical signs are normal. It often rises significantly in widespread inflammatory disorders caused by infection or autoimmune mechanisms; such elevations may be prolonged in localized inflammation and malignancy.
Note: ESR is also frequently raised during and after reactions and fevers induced by the Gerson Therapy.
Normal sedimentation rates range from 0 to 20 mm/hour; rates gradually increase with age.
The ESR rises in pregnancy, acute or chronic inflammation, tuberculosis, paraproteinemias (especially multiple myeloma and Waldenstrom's macroglobulinemia), rheumatic fever, rheumatoid arthritis, and some malignancies. Anemia also tends to raise ESR, since less upward displacement of plasma occurs to retard the relatively few sedimenting RBCs. Polycythemia, sickle cell anemia, hyperviscosity, or low plasma protein level tends to depress ESR.
Platelets, or thrombocytes, are the smallest formed elements in the blood. They are vital to the formation of the hemostatic plug in vascular injury, and promote coagulation by supplying phospholipids to the intrinsic thromboplastin pathway. Platelet count is one of the most important screening tests of platelet function. Accurate counts are vital for monitoring chemotherapy, radiation therapy, or severe thrombocytosis and thrombocytopenia. A platelet count that falls below 50,000 can cause spontaneous bleeding; when it drops below 5,000, fatal central nervous system bleeding or massive gastrointestinal hemorrhage is possible.
Properly prepared and stained peripheral blood films provide a reliable estimate of platelet number if the sample shows at least one platelet for every 10 to 20 red blood cells visible in an oil-immersion field. A more accurate visual method involves use of a hemacytometer counting chamber and a phase microscope. The most accurate measurement, however, employs the voltage pulse or electro-optical counting system. Nevertheless, results from such automated systems should always be checked against a visual estimate from a stained blood film.
Normal platelet counts range from 130,000 to 370,000/mm3 [130 to 370 x 10"/L].
A decreased platelet count (thrombocytopenia) can result from aplastic or hypoplastic bone marrow; infiltrative bone marrow disease, such as carcinoma, leukemia, or disseminated infection; megakaryocytic hypoplasia; ineffective thrombopoiesis caused by folic acid or vitamin B-12 deficiency; pooling of platelets in an enlarged spleen; increased platelet destruction caused by drugs or immune disorders; disseminated intravascular coagulation; Bernard-Soulier syndrome; or mechanical injury to platelets.
An increased platelet count (thrombocytosis), can result from hemorrhage; infectious disorders; malignancies; iron deficiency anemia; recent surgery, pregnancy, or splenectomy; and inflammatory disorders, such as collagen vascular disease. In such cases, the platelet count returns to normal after the patient recovers from the primary disorder. However, the count remains elevated in primary thrombocytosis, myelofibrosis, with myeloid metaplasia, polycythemia vera, and chronic myelogenous leukemia.
When the platelet count is abnormal, diagnosis usually requires further studies, such as a complete blood count, bone marrow biopsy, direct antiglobulin test (direct Coombs' test), and serum protein electrophoresis.
Medications that may decrease platelet count include acetazolamide, acetohexamide, antimony, antineoplastics, brompheniramine maleate, carbamazepine, chloramphenicol, ethacrynic acid, furosemide, gold salts, hydroxychloroquine, indomethacin, isoniazid, mephenytoin, mefenamic acid, methazolamide, methimazole, methyidopa, oral diazoxide, oxyphenbutazone, penicillamine, penicillin, phenylbutazone, phenytoin, pyrimethamine, quinidine sulfate, quinine, salicylates, streptomycin, sulfonamides, thiazide and thiazide-like diuretics, and tricyclic antidepressants. Heparin causes transient, reversible thrombocytopenia.
Part of the complete blood count, the white blood cell (WBC) count reports the number of white cells found in a microliter (cubic millimeter) of whole blood by using a hemacytometer or an electronic device, such as the Coulter counter.
On any given day, WBC counts may vary by as much as 2,000. Such variation can be the result of strenuous exercise, stress, or digestion. The WBC count may rise or fall significantly in certain diseases, but is diagnostically useful only when interpreted in light of the white cell differential and of the patient's current clinical status.
Leukocytes White blood corpuscles. There are two types: granulocytes (those possessing granules in their cytoplasm), and agranulocytes (those lacking granules). Granulocytes include juvenile neutrophils (3 to 5%), segmented neutrophils (54 to 62%), basophils (O to 0.75%), and eosinophils (1 to 3%). Agranulocytes include lymphocytes, large and small (25 to 33%), and monocytes (3 to 7%).
Not all leukocytes are formed in the same place nor in the same manner. Granulocytes are formed in the bone marrow, arising from large cells called megakaryocytes. Lymphocytes are formed in the lymph nodes and probably in bone marrow. Monocytes are formed from the cells lining the capillaries in various organs, probably principally in the spleen and bone marrow.
Function: Leukocytes act as scavengers, helping to combat infection. They travel by ameboid movement and are able to penetrate tissue and then return to the bloodstream. The direction of movement is probably due to the stimuli from injured cells, called chemotaxis. When invading bacteria destroy them, the dead leukocytes collect in the form of pus, causing an abscess if a ready outlet is not available.
Leukocytes, especially the granular forms, are markedly phagocytic, i.e., have the power to ingest paniculate substances. Neutrophils ingest bacteria and small particles; other cells such as the monocytes and histiocytes in the tissues ingest larger particles. They are important in both defensive and reparative functions of the body. Basophils most probably function by delivering anticoagulants to facilitate blood clot absorption or to prevent blood coagulation. Eosinophils increase in number in certain conditions such as asthma and infestations of animal parasites. Lymphocytes are not phagocytic. B-cell lymphocytes produce antibodies and T-cell lymphocytes are important in producing cellular immunity.
A greatly diminished number of erythrocytes is found in the anemias, and a greatly increased number of leukocytes (leukocytosis) is usually indicative of bacterial infection. A leukocyte count is usually taken preoperatively if infection is suspected, such as in appendicitis. A count may also be taken following surgery to be sure than an occult wound infection has not developed.
The WBC count ranges from 4.1 to 10.9 x 10".
An elevated WBC count (leukocytosis) usually signals infection, such as an abscess, meningitis, appendicitis, or tonsillitis. A high count may also result from leukemia and tissue necrosis caused by burns, myocardial infarction, or gangrene.
A low WBC count (leukopenia) indicates bone marrow depression that may result from viral infections or from toxic reactions, such as those following treatment with antineoplastics, ingestion of mercury or other heavy metals, or exposure to benzene or arsenicals. Leukopenia characteristically accompanies influenza, typhoid fever, measles, infectious hepatitis, mononucleosis, and rubella.
Because the white blood cell (WBC) differential evaluates the distribution and morphology of white cells, it provides more specific information about a patient's immune function than the WBC count. In this test, the laboratory classifies 100 or more white cells in a stained film of peripheral blood according to two major types of leukocytes - granulocytes (neutrophils, eosinophils, and basophils) and non-granulocytes (lymphoctyes and monocytes) - and determines the percentage of each type. The differential count is the relative number of each type of White cell in the blood. Multiplying the percentage value of each type by the total WBC count provides the absolute number of each type of white cell. Although little is known about the function of eosinophils in the blood, abnormally high levels of these cells are associated with various allergic diseases and reactions to parasites. In such cases, an eosinophil count is sometimes ordered as a follow-up to the white cell differential. This test is also appropriate if the differential WBC count shows a depressed eosinophil level.
Reference values: White blood cell differential
Cells (Rel. Value - Absolute Value)
Neutrophils: (47.6 to 76.8% - 1950 to 8400 microliters)
Lymphocytes: (16.2 to 43% - 660 to 4,600 microliters)
Monocyies: (0.6 to 9.6% - 24 to 960 microliters)
Eosinophils: (0.3 to 7% - 12 to 760 microliters)
Bosophils: (0.3 to 2% - 12 to 200 microliters)
Neutrophils: (boys: 38.5 to 71.5%, girls: 41.9 to 76.5%)
Lymphocytes: (boys: 19.4 to 51.4%, girls: 16.3 to 46.7%)
Monocyies: (boys: 1.1 to 11.6%, girls: 0.9 to 9.9%)
Eosinophils: (boys: 1 to 8.1%, girls: 0.8 to 8.3%)
Bosophils: (boys: 0.25 to 1.3%, girls: 0.3 to 1.4%)
To make an accurate diagnosis, the examiner must consider both relative and absolute values of the differential. Considered alone, relative results may point to one disease, while masking the true pathology that would be revealed by considering the results of the white cell count. For example, consider a patient whose white blood cell count is 6,000/microliter, and whose differential shows 30% neutrophils and 70% lymphocytes. His relative lymphocyte count would seem to be quite high (lymphocytosis); but when this figure is multiplied by his white cell count - 6,000 x 70% = 4,200 lymphocytes/microliter - it is well within the normal range.
This patient's neutrophil count, however, is low (30%) and when this is multiplied by the white cell count - 6,000 x 30% = 1,800 neutrophils/microliter - the result is a low absolute number.
This low result indicates decreased neutrophil production, which may mean depressed bone marrow.
An increase in neutrophils (polys) is found in the following:
A decrease in neutrophils is found in the following:
| Macroscopic | |
| color | straw |
| odor | slightly aromatic |
| appearance | clear |
| specific gravity | 1.005 to 1.020 |
| pH | 4.5 to 8.0 |
| protein | none |
| glucose | none |
| ketones | none |
| other sugars | none |
red blood cells: 0 to 3 / high power field
white blood cells: 0 to 4 / high power field
casts: none, except occasional hyaline casts
Variations in urinalysis findings may result from diet, nonpathologic conditions, specimen collection time, and other factors.
The following benign variations are commonly nonpathologic:
Specific gravity: Urine becomes darker and its odor becomes stronger as the specific gravity increases. Specific gravity is highest in the first-voided morning specimen.
Urine pH: Greatly affected by diet and medications, urine pH influences the appearance of urine and the composition of crystals. An alkaline pH (above 7.0) - characteristic of a diet high in vegetables, citrus fruits, and dairy products but low in meat - causes turbidity and the formation of phosphate, carbonate, and amorphous crystals. An acid pH (below 7.0) - typical of a high-protein diet - produces turbidity and formation of oxalate, cystine, amorphous urate, and uric acid crystals.
Protein: Normally absent from the urine, protein can appear in urine in a benign condition known as orthostatic (postural) proteinuria. This condition is most common during the second decade of life, is intermittent, appears after prolonged standing, and disappears after recumbency. Transient benign proteinuria can also occur with fever, exposure to cold, emotional stress, or strenuous exercise.
Sugars: Also usually absent from the urine, sugars may appear under normal conditions. The most common sugar in urine is glucose. Transient, non-pathologic glycosuria may result from emotional stress or pregnancy and may follow ingestion of a high-carbohydrate meal. Other sugars - fructose, lactose, and pentose - rarely appear in urine under nonpathologic conditions. (Lactosuria, however, can occur during pregnancy and lactation).
Red cells: Hematuria may occasionally follow strenuous exercise.
The following abnormal findings generally suggest pathologic conditions:
Color: Changes in color can result from diet, drugs, and many metabolic inflammatory, or infectious diseases.
Note: Beets cause pink or even light red urine, often mistaken for bleeding by new Gerson patients.
Odor: In diabetes mellitus, starvation, and dehydration, a fruity odor accompanies formation of ketone bodies. In urinary tract infection, a fetid odor is common. Maple syrup urine disease and phenyiketonuria also cause distinctive odors. Note: Asparagus causes a strong fruity odor which is of no clinical significance.
Turbidity: Turbid urine may contain blood cells, bacteria, fat, or chyle, suggesting renal infection.
Specific gravity: Low specific gravity (less than 1.005) is characteristic of diabetes insipidus, nephrogenic diabetes insipidus, acute tubular necrosis, and pyelonephritis. Fixed specific gravity, in which values remain 1.010 regardless of fluid intake, occurs in chronic glomerulonephritis with severe renal damage. High specific gravity (greater than 1.020) occurs in nephrotic syndrome, dehydration, acute glomerulonephritis, congestive heart failure, liver failure, and shock.
pH: Alkaline urine pH may result from Fanconi's syndrome, urinary tract infection, and metabolic or respiratory alkalosis. Acid urine pH is associated with renal tuberculosis, pyrexia, phenyiketonuria and alkaptonuria, and all forms of acidosis. Note: The Gerson Therapy causes constant alkaline tides in high urinary pH.
Protein: Proteinuria suggests renal diseases, such as nephritis, nephrolithiasis, polycystic kidney disease, and renal failure. Proteinuria can also result from multiple myeloma.
Sugars: Glycosuria usually indicates diabetes mellitus but may also result from pheochromocytoma. Gushing's syndrome, and increased intracranial pressure. Fructosuria, galactosuria, and pentosuria generally suggest rare hereditary metabolic disorders. However, an alimentary form of pentosuria and fructosuria may follow excessive ingestion of pentose or fructose, resulting in hepatic failure to metabolize the sugar. Because the renal tubules fail to reabsorb pentose or fructose, these sugars, spill over into the urine.
Ketones: Ketonuria occurs in diabetes mellitus when cellular energy needs exceed available cellular glucose. In the absence of glucose, cells metabolize fat, an alternate energy supply. Ketone bodies - the end products of incomplete fat metabolism - accumulate in plasma and are excreted in the urine. Ketonuria may also occur in starvation states and in conditions of acutely increased metabolic demand associated with decreased food intake, such as diarrhea or vomiting.
Cells: Hematuria indicates bleeding within the genitourinary tract and may result from infection, obstruction, inflammation, trauma, tumors, glomerulonephritis, renal hypertension, lupus nephritis, renal tuberculosis, renal vein thrombosis, hydronephrosis, pyelonephritis, scurvy, malaria, parasitic infection of the bladder, subacute bacterial endocarditis, polyarteritis nodosa, and hemorrhagic disorders. Numerous white cells in urine usually imply urinary tract inflammation, especially cystitis or pyelonephritis. White cells and white cell casts in urine suggest renal infection. An excessive number of epithelial cells suggests renal tubular degeneration.
Casts: (plugs of gelled proteinaceous material [high-molecular-weight mucoprotein]): Casts form in the renal tubules and collecting ducts by agglutination of protein cells or cellular debris, and are flushed loose by urine flow. Excessive numbers of casts indicate renal disease. Hyaline casts are associated with renal parenchymal disease, inflammation, and trauma to the glomerular capillary membrane; epithelial cast, with renal tubular damage, nephrosis, eclampsia, amyloidosis, and heavy metal poisoning; coarse and fine granular cast, with acute or chronic renal failure, pyelonephritis, and chronic lead intoxication; fatty and waxy cast, with nephrotic syndrome, chronic renal disease, and diabetes mellitus; red blood cell cast, with renal parenchymal disease, renal infarction, subacute bacterial endocarditis, vascular disorders, sickle cell anemia, scurvy, blood dyscrasias, malignant hypertension, collagen disease, and acute inflammation; and white blood cell cast, with acute pyelonephritis and glomerulonephritis, nephrotic syndrome, pyogenic infection, and lupus nephritis.
Crystals: Some crystals normally appear in urine, but numerous calcium oxalate crystals suggest hypercalcemia. Cystine crystals (cystinuria) reflect an inborn error of metabolism.
Other components: Yeast cells and parasites in urinary sediment reflect genitourinary tract infection, as well as contamination of external genitalia. Yeast cells, which may be mistaken for red cells, can be identified by their ovoid shape, lack of color, variable size, and frequently, signs of budding. The most common parasite in sediment is Trichomonas vaginalis, a flagellated protozoan that commonly causes vaginitis, urethritis, and prostatovesiculitis.
Experimental evidence for the nutritional superiority of foods grown with organic fertilization
(Excerpted from the Gerson Healing Newsletter, Vol. 5, No. 2, 1989)
People who grow and eat organic produce like to tell other people that organic fruits and vegetables not only taste better, but that they are "better for you". People who grow and eat commercial produce tend to think that this is a lot of hogwash.
I remember stopping at a nice looking stand in a farmers' market to ask, "Is any of your produce organic?"
The farmer squinted at me, stonefaced, as though I had spoken to him in Swedish. After a short and uncomfortable silence, he answered, "Of course it's organic. If it grows in the ground it's organic."
I asked, "Do you spray it for insects?"
"Of course I do," he answered with a tone of exasperation; "you won't find bugs on any of my stuff."
I was already walking away from his booth as his voice dropped to a disgruntled mutter. I had decided a long time ago that whenever I could avoid pesticide exposure I would. I chose to eat organically grown foods because I reasoned that they were likely to be safer, considering especially the inadequacy of testing in the U.S. and the ineptitude and carelessness of the least competent handlers of these dangerous chemicals.
But, imagine with me for a moment what it might be like if pesticides were no longer a problem. Envision, if you will, a world in which consumer preference has eroded the market for foods grown with toxics. Instead, integrated pest management and biological controls are being used.
In this new scenario, will we really need organically grown foods anymore? Are they so much better than chemically grown foods?
To learn more, we must return to an unsettled argument about the different effects of pure chemical fertilizers versus organic composts.1−3 This controversy has brewed since the turn of the century.4−7 Commercial farmers use growth stimulating nitrogen, phosphorus and potassium (NPK) in sometimes very large quantities; organic growers fertilize with only farmyard manure and compost from chemical-free sources.
For many years, the U.S. Department of Agriculture has maintained that there is no discernible difference between conventional and organic produce9 while organic growers have maintained that theirs is better.10−12
We found that early experiments support the possibility that organic methods can and do produce foods nutritionally superior for some species of animals. But they are not conclusive regarding the human population. Animal feeding experiments conducted in the 1920's by McCarrison20 and later supported by findings of McSheehy14 are compelling evidence that there is something fundamentally different and better about plants grown with the benefit of organic composts. In all these experiments, animals fed organically fertilized foods outperformed those fed chemically fertilized foods.
It has been established as scientific fact that plants derive nutrients from the soil.15−19 In 1929, Rowlands and Wilkinson wrote in the British Medical Journal that their findings confirmed those of McCarrison.20 In their rat study, they compared the healthy growth of rats fed organically fertilized seed with the abnormal growth and disease of rats fed chemically fertilized seed. They used vitamin B replacement to correct the poor health of rats fed "artificial seed", and proposed that such seed may be lacking in vitamin B.
That micronutrients non-essential for plant growth are important in animal and human nutrition is accepted.21 Whether these micronutrients must be supplied by agricultural products is debated by industry.22
Some argue that all necessary nutrients are supplied by conventionally grown foods which are held to be exactly equivalent to organically grown foods in nutritive value.23−26
Advocates of organic growing methods are united around the idea that organically grown foods are nutritionally superior to chemically grown foods.1−7, 13, 14, 20, 27−29
Major differences of opinion stem from the discovery that plants of superior size and appearance can be grown in widely differing soils with the addition of large quantities of growth stimulating nitrogen, phosphorus, and potassium (NPK) fertilizer. USDA hailed NPK as a great advance in farming because its remarkably increased yields promised to feed the world.30
But comparisons of organic and chemically grown foods require much more concrete validation than can be supplied by beliefs, convictions and opinions, no matter how passionate or assertive they may be.
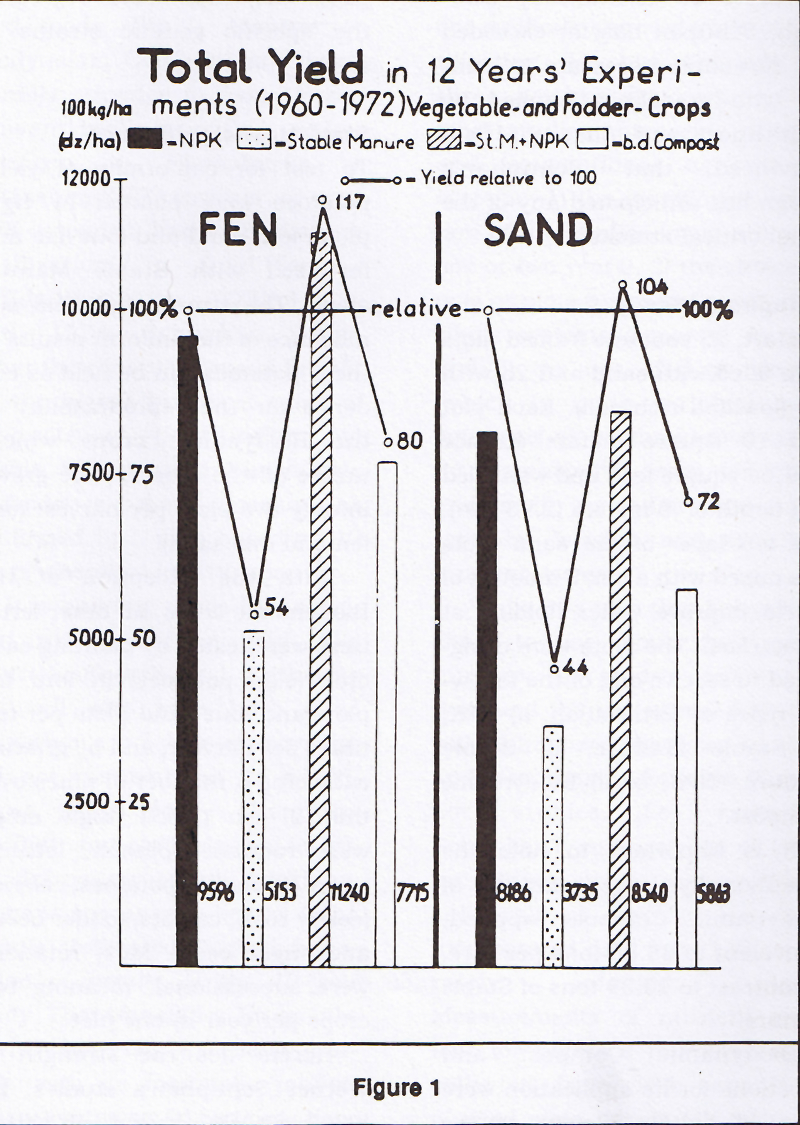
To my knowledge, the only scientific experiments of adequate design and sufficient duration to address questions regarding the composition of organic vs. chemically fertilized foods in terms of nutrients are those of Doctor Werner Schuphan, Professor, Lecturer, and for years Director of Germany's Federal Institute for Research of Quality in Plant Production.
In 1974, after thirty-six years of research comparing the soils and plant products of organic compost fertilization with those of chemical fertilizers, Schuphan published findings and conclusions based on a 12-year comprehensive experiment. Conclusions regarding importance of his findings to human nutrition were based on Schuphan's prior labors in human infant feeding experimentation.
Schuphan was definite and emphatic that organically fertilized foods (Stable Manure or Biodynamic Compost) are nutritionally superior to foods grown conventionally with either Nitrogen + Phosphorus + Potassium (NPK) fertilizer, or even NPK-amended barnyard manure fertilization. In Qual. Plant - PI. Fds. hum. Nutr. XXIII, 4:333-358, 1974, Schuphan wrote,
"That the consumer would benefit by the higher biological value of products of (fertilization by) Stable Manure and Biodynamic Compost is beyond question, as confirmed by ... data based on 12 years' chemical investigations."
It is puzzling to me that excellent writers in the field, like Dietrich Knorr31 and Katherine Clancy27 who have both cited Schuphan's 12-year experiment, did not comment on its significance which derives from the strength and chronological length of Schupan's study designs. Perhaps the answer lies in Qual. Plant's clubfooted English translation of results of the 12-year study. That translation (in an otherwise generally excellent journal), with its frequently jabberwocky syntax could certainly have proved daunting to even their fine intellects.
I found the going very rough, but after some fretting and frustration over identification of idioms and grammatic intent, meaning surfaced gradually in the murky translation. Schuphan's solid experimental design and intelligent classical methodology revealed themselves in simple clarity.
Knorr has written intelligently regarding the collective shortcomings of the majority of efforts to compare plant products of different methods and materials of fertilization. He has pointed31 to three weaknesses common to most studies comparing organic and conventional agricultural systems: 1) the insufficient duration of the studies (most are only one or two years), 2) the choice of pots or plots instead of comparing whole systems (separate farms), and 3) the use of fresh weight (which is quite variable) with emphasis on yield and food quality (organoleptic tests for taste and smell), instead of more accurate dry weights and essential nutrient assays.
While it is true that Schuphan chose to use plots, their great number, the study's long duration, and the use of two different soils minimized the types of bias and error usually found in "flower pot" studies. For example, Schuphan's comparisons of yield for spinach, grown on four different fertilizers over five harvests, incorporated data from 130 separately planted plots. Measurements of nutrient content for potatoes represent data collected from 104 separately planted plots. Absolutely none of Schuphan's findings were taken from only one harvest.
Rather than fresh (wet) weight, Schuphan used dry weight to measure yield, and conducted nutrient assays, soil tests, humus evaluations, and, importantly, toxicology tests.
Allaway called in 197532 for strong study designs and replications with emphasis on the inherent deficiencies in some soils. Schuphan has created a study with many replications which utilized both rich soil and nutrient-poor sand.
Through his conscientious efforts to be scientifically thorough, Schupan has far exceeded any measures necessary to comply with guidelines implied by both Knorr and Allaway. I am convinced that Schuphan's design has anticipated any of the usual critical attacks.
To start, 25 concrete framed plots were filled with sand and 25 with fen (lowland rich soil). Each plot had 10 square meters surface (107.64 square feet) and was filled to a depth of .9 meters (2.95 feet). The top layer of the sand plots was mixed with a small amount of fen to improve water holding at the surface. The plots were designated to receive one of the following types of fertilization: a) NPK, b) Stable Manure, c) Stable Manure +NPK, or d) Biodynamic Compost.
It is important to note the exceptionally large quantity of Biodynamic Compost applied, equivalent to 38.38 tons per acre, in contrast to 13.39 tons of Stable Manure.
Biodynamic Compost and directions for its application were supplied by Dr. Heinze of the Forschungsring für biologischdynamische Wirtschaftsweise (Research Circle for Methods of Biodynamic Application) in Darmstadt-Eschollboicken.
The Stable Manure itself was of "low quality" (low nitrogen) and varied little from year to year. No notes were supplied by Schuphan, regretfully, regarding the nature of the animals nor their feed, e.g.: fresh grasses, grains, silage, hay. In future studies, such information could be valuable in comparisons of various Stable Manuring materials and practices. Likewise not supplied was information regarding the specific genetic strains of seeds.
To test for conformity of yield, potatoes were planted in eight plots, four sand and four fen, and fertilized with Stable Manure alone. The strong statistical significance of the uniform results in these potatoes can be held as evidence for the reproducibility of the Biodynamic crops which, unlike all the others, were grown in only two plots per harvest (one fen and one sand).
With the exception of the Biodynamic crops, all other fertilizers were tested by planting each crop (e.g.: potatoes) in four fen plots and four sand plots per fertilizer per harvest, and by growing each crop a number of times over the 12 year period. Eight crops were rotated: spinach, lettuce, savoy (cabbage), potatoes, celeriac (celery root), carrots, fodder beets, and sugar beets. Most rotations were successional, meaning two crops per year in one plot.
Herein lies the strength of Werner Schuphan's studies. He has built an experiment within which is designed a protocol for simultaneous production of multiple replications. Additionally, he has analyzed a representative set of replications for reproducibility and has shown high statistical significance. With the exception of the Biodynamic fertilizer (due perhaps to the sheer weight of fertilizer required), all other experiments have been carried out four times on each of two soils per harvest. In this way, each crop was grown in 26 plots per harvest. That, ladies and gentlemen, is an excellent example of the traditional methods of the Golden Age of German Science.
Where applicable, results were averaged according to four morphological types represented by spinach, savoy, potatoes, and carrots.
Unfortunately, yield is the contemporary farmer's first concern. We have made it so. If, instead, his first concern were the nutritional value of the produce, his practice would be considerably different. The structure of our economy has not made it desirable or possible for the farmer to put his emphasis on biological value.
Schuphan found that organic fertilization could in no way compete in terms of yields with NPK. He wrote,
"These data reflect at the same time the tremendous role of fertilizer practice on yield, and the function of the soil as a significant environmental factor influencing yield."
Dr. Schuphan chose NPK-stimulated crop yields as the representative norm. However, if growers adopt "biological value" as their primary goal, such gigantic chemically pushed yields may become impossible. Never-the-less, using NPK fertilization as the standard (100%) for conventional yield, the bar graph in figure one shows that Stable Manure by itself produces only a 54% yield on fen and an even lower 44% yield on sand. By comparison, Biodynamic Composting scored yields of 80% on fen and 72% on sand. The combination of NPK and Stable Manure produced the highest result, 117% yield on fen and 104% on sand.
It is important to note that Schuphan reported that representatives of Biodynamic management plans suggest that yields will be low for five building years.
Considerable differences in yield are seen in Schuphan's comparison of spinach (a rosette), savoy (a large terminal bud), potatoes (a stem tuber), and carrots (a storage root). Highest yields in succeeding crops (two crops in one plot in one season) were attained on fen in 1963 by early savoy and carrots, followed by spinach and celeriac in 1969. In single main crops, fodder beets in 1968 led all others.
As expected, in comparisons of four different crops grown by the four methods of fertilization, increased yields of all NPK treated crops are remarkable. In spinach and in savoy, NPK surplus yields ranged up to slightly more than 80% above the competing fertilizers. In carrots, NPK yields were up to 53% increased, and in potatoes up to 41%. There was one surprising exception to this general rule: potatoes grown on Biodynamically fertilized plots yielded up to 19% above those grown on NPK.
Soil analyses provided some surprises. Schuphan wrote,
"Our expectations after 12 year's experimental work - that humus contents of soil would correspond to humus supply by organic matter - was not realized in fen soil."
Humus is the organic portion of the soil, from decaying plant and animal matter. It is rich with microbes. Theoretically, according to Schuphan, humus is thought to provide abundant plant nutrients which are released by warmth and moisture, the same conditions that stimulate plant growth.
Schuphan observed and reported an apparent paradox: Fen soil in those plots which received the largest yearly quantities of organic inputs (Biodynamic Compost and Stable Manure) tested with the lowest levels of humus at the end of 12 years of consecutive fertilization.
The breakdown was as follows: Fen soil in plots treated with NPK + Stable Manure exhibited the highest humus content on analysis, some 70+ mg/100g soil. In second place for humus content, again surprisingly, was soil from those plots treated with only NPK, at 67mg/100g soil. Third place went to plots treated with Stable Manure, 65mg/100g soil.
Biodynamic Compost treated plots were tested at an astonishingly low 55 mg/100g soil, despite the addition of the equivalent of more than 38 tons per acre of Biodynamic Compost yearly for 12 years (compared to 13.39 tons/acre/year of Stable Manure).
Please look at the above paragraph again. Note that fen soil from NPK treated plots, which produced the highest crop yields, and which received absolutely no organic amendments, finished 12 years of consecutive, successional cropping with a higher content of humus than either those plots fertilized with Stable Manure or those treated with Biodynamic Compost. Why?
Schuphan did not attempt an answer. It is interesting to note that there was a very small buildup, especially with Biodynamic Compost, of humus in the sand-containing plots which received organic amendments. Again, Schuphan made the observation without discussion. Comparisons of humus and plant nutrients in fen and sand are not without difficulties.33
Schuphan conservatively avoided a discussion of mechanisms for the buildup of humus in NPK-treated soil. In addition, he reported extremely high contents of K2O, Fe, P2O3, Ca and Mn in fen soil plots treated for 12 years at with Biodynamic Compost. Rationalizing the latter, Schuphan suggested that low yields against high organic inputs might result in such mineral buildups.
Regardless of what was happening with the humus, the most important findings resulted from nutrient assays of crops.
In his own words, Schuphan reported:
"Let us draw the most remarkable results to your attention. The most convincing facts are the much higher contents of minerals - with the exception of sodium - due to organic fertilizing. Potassium and iron show the greatest increases overall. Magnesium and calcium were also remarkably increased in savoy. Contents of sodium, with the exception of potatoes, are markedly decreased."
In 197234, "Schuphan pointed out that fruits and vegetables have a health-favoring" high potassium to low sodium and chloride ratio. This is directly opposed to animal products such as meat, milk, eggs, etc., which do not have a good ratio. Schuphan wrote,
"It must be taken into account that according to our experimental results, attractive cooking methods in which one cooks with plenty of water, throws away the cooking water, and seasons strongly with salt, cause an unfavorable partial displacement of minerals and significant loss of potassium. This points strongly toward the great value of pressed vegetable and fruit juices for dietetic purposes."
Just a few of the overall findings will suffice to show a trend. Compared with that grown on NPK-fertilized fen, spinach grown on organically fertilized fen soil contained from 64% (Biodynamic Compost) to 78% (Stable Manure) more ascorbic acid (Vitamin C).
In sand, spinach contained 30% (Biodynamic Compost) to 54% (Stable Manure) more ascorbic acid.
Savoy on organically fertilized fen contained 76% (Stable Manure) to 91% (Biodynamic Compost) more ascorbic acid. Savoy on sand tested at 64% (Biodynamic Compost) to 85% (Stable Manure) more ascorbic acid than that grown on NPK.
On fen soil, both Stable Manure and Biodynamic Compost increased the ascorbic acid content of lettuce by 59%. On sand, the increase was only 6% (Stable Manure) to 9% (Biodynamic Compost).
Against the trend toward higher nutrient contents, carotene-containing crops showed moderate decreases with organic fertilization, as much as almost 20% below the NPK norm. Schuphan noted that carotene is a
"surplus product of plant metabolism, its synthesis being promoted by mineral fertilizing and favorable ecological conditions."
The need for more study, both of carotenes in biological (animal) systems, and of their intrinsic nature in plants, is obvious.
Relative protein, a concern for those on limited diets, is increased in crops grown on organically fertilized fen soil. The increase in spinach is from 4% (Stable Manure) to 6% (Biodynamic Compost), in savoy from 33% (Stable Manure) to 40% (Biodynamic Compost), in lettuce from 15% (Biodynamic Compost) to 24% (Stable Manure), in celeriac 24% (Biodynamic Compost) to 37% (Stable Manure), and in carrots from 21% (Biodynamic Compost) to 25% (Stable Manure). In potatoes, the increases were only slight, never as much as 10%.
In sand fertilized by organic inputs, the results were similar to the above, with a large difference showing only in carrots which were only barely higher than sand-NPK carrots.
The argument of organic vs. chemical fertilization hinges on two opposing issues: 1) maximum yield against 2) biological value.34 Figuratively, biological value can be thought of as the sum of the actions of all components, both those that exhibit positive action like the vitamins, and those with negative action like the nitrates.35 Schuphan's findings regarding amino acids and conjugated proteins in the above and the current studies throw much weight to the biological value side of the balance.
Heavy nitrogen fertilization results in a decrease in crops of the sulfur-containing amino acid methionine.36,37 Methionine is essential in plant metabolism for the transfer of methyl (CH3) from one compound to another. According to the above and earlier findings of Schuphan, diminished methionine content of crops due to heavy nitrogen fertilization results in decreased biological value of plant proteins.38
In the current experiments, both potatoes and spinach grown on organically fertilized fen and sand exhibited increases in methionine (expressed as a % of crude protein) from 11% to 47% above the NPK norms.
Schuphan observed a concurrent slight decrease in both glutamic acid and lysine in organically fertilized plants. In his opinion, enhancement of lysine content of crops, which increases with nitrogen fertilization, is not worth the loss of methionine and overall biological value of conjugated plant proteins. Lysine is touted by some nutritionists as playing a major role in the accelerated growth of young people of the Western World. It is richly supplied by animal foods of which there is plentiful supply. There is no need to devalue plant proteins in search of lysine stores for the public.
Schuphan wrote, "We may come to the conclusion that organic manuring un-equivocally favors sulfur-containing methionine, one of the most important amino acids. Breeders are very keen on genetically improving plant proteins by increasing their methionine contents. We have made it clear, however, that techniques of cultivation - more precisely, techniques of fertilization - may also help in this respect."
Good looking, giant fruits and vegetables are considered desirable in the food industry. However, the measure of their food value is not their size and harvest weight, but rather their dry weight, which is a measure of their actual contents. Large, beautiful vegetables can be waterlogged and low in nutritional values. As one might suspect from the increased nutrient levels in organically fertilized crops, their dry weight is above that of their chemically fertilized counterparts. Using chemically fertilized crops as the standard (100%), Schuphan demonstrated increases in dry matter in organically fertilized plants. In some crops treated with Stable Manure the gain in dry weight was as high as 69% above the NPK norm. Some crops treated with Biodynamic Compost ranged up to 96% beyond those fertilized with NPK.
Schuphan earlier published34 concerns regarding potential health hazards to infants of high Nitrate crops, especially over-fertilized spinach. In this study he wrote,
"The most surprising result is the behavior of nitrate-N in spinach. Organic manuring both with Stable Manure and Biodynamic Compost results in extremely low contents of nitrate-N. No hazards to health whatsoever could be expected when such a `low-nitrate-spinach' was fed to infants."
Nitrogen fertilized plants attract aphids more than is normal.39 Observing that aphids require free amino acids from the stream of the vascular bundles of p1ants40,41 Schuphan observed that organically grown plants are less susceptible to aphids for three reasons: 1) they have more collenchymatous thickening and subsequently more strength in cellular walls, 2) they have lower water content, and 3) they have lower contents of free amino acids.
In a nine-year set of three separate infant feeding experiments42−44 high contents of vitamins and minerals in crops were associated with health benefits to infants, including increases in daily weight gain, carotene in blood, vitamin C in blood, tolerance to teething, serum iron, and an improved red blood picture.
Schuphan points out that the nutritional constituents analyzed in the current studies are the same as those used to determine nutritional value in the infant feeding experiments which ran from 1936-1944. He asserts,
"That is the reason why we claim validity for expressing our results in nutritional values."
On the whole, Schuphan's results support the argument that organic manuring produces foods which are nutritionally superior to those grown on chemical fertilizer. Let's look at some averages to help us to understand Schuphan's experimental evidence for the nutritional superiority of crops grown with the aid of either Stable Manure or Biodynamic Compost.
In comparison with NPK-fertilized crops which are assigned the relative norm of 100%, crops grown in both fen and sand with Stable Manure fertilizer or Biodynamic Compost fertilizer averaged higher in positive biological factors and lower in in negative factors (Figures 2 and 3).
Schuphan asserts that chemical fertilizers are used solely for a one-sided economic benefit to the food industry through remarkable increases in yield. In my opinion, this does not necessarily translate into gains for the farmer, whose commodities are therefore available often in such surplus that they are grossly devalued in a desperate effort to compete far buyers on the exchanges.11
Now that Schuphan has established a factual basis for the nutritional superiority of organically grown foods as they relate to human nutrition, let us look again at the experiments of McCarrison and McSheehy. Findings of this sort in animals, tied now to human nutrition through the labors of Schuphan, suggest the horrible reality that contemporary human nutrition constitutes a long term deficiency feeding experiment.
Standardization of organics industry practices must include generation and collection of the best scientific data regarding nutritional values in order to further the philosophical and practical knowledge and intent which gave birth to the industry. Industry credibility, which is vital, can be enhanced only by careful science.
It is important here to point out that Schuphan's results cannot be said to apply directly to all produce grown by various organic farming methods. It gives us some specific knowledge regarding several specific methods of organic fertilization and crop management. But what we are not told is far greater in scope than what we are told.
| Factors having a positive | ||
| biological Influence: | ||
| NPK | Organic | |
| Dry Matter | 100% | 123% |
| Relative Protein | 100% | 118% |
| Ascorbic Acid | 100% | 128% |
| Total Sugars | 100% | 119% |
| Methionine | 100% | 123% |
| (determined in potatoes | ||
| and spinach only) | ||
| Potassium | 100% | 118% |
| Calcium | 100% | 110% |
| Phosporus | 100% | 113% |
| Iron | 100% | 177% |
| (determined in | ||
| spinach only) | ||
| Figure 2 | ||
| Factors having a negative | ||
| biological Influence: | ||
| NPK | Organic | |
| Nitrates | 100% | 7% |
| (determined in spinach only | ||
| in 1962, 1969, and 1972) | ||
| Free Amino Acids | 100% | 58% |
| Sodium | 100% | 88% |
| Figure 3 | ||
And we must therefore call for wide researches into nutritional qualities of foods grown by different methods of organic fertilization. Schuphan's twelve-year study with its basis in prior infant feeding experimentation should serve as a model for future researches. Other defined methods of organic growing should be put to similar tests.
Industry inertia is massive, and a way of doing business has been entrenched for many years which favors yield and cosmetics instead of biological value. But increasing numbers of consumers are more and more aware, vocal and active, sometimes militantly, against toxics and for nutritionally superior organically grown food.
There is a great, long journey ahead. But tomorrow holds hope if we will only pick up our bags and walk there.
By Gar Hildenbrand and Christeene Lindsay
(Excerpted from the Gerson Healing Newsletter, Vol. 5, No. 1, 1989)
Readers of this newsletter have repeatedly and urgently expressed a desire to know what they themselves might do to improve their health and to prevent disease. In this day of miracle medicines and potent patented pills, what do the authoritative leaders, the frontier guides, of the Gerson Institute recommend? Is there some new supplement, some special herb, some newly refined co-nutritive factor which might be the missing link?
Yes. We can make some recommendations:
Please eat an unsalted, very low-fat diet of "organically grown" fruits, vegetables and whole grains. Supply eight ounces daily of dense non-fat dairy protein (dry curd) or its equivalent in quite moderate amounts of animal products, mostly poultry and fish.
75% of the diet should be comprised of fruits and vegetables altered as little as possible, much of it raw and freshly prepared.
Please intelligently avoid all additives, including emulsifiers, preservatives, colorings, and flavorings even when these are labeled "natural" (an intentionally deceptive term).
When you cook, please use no fats (oil, lard, vegetable shortening, butter) and no cooking water. Use tightly covered bakeware at temperatures below the boiling point of water, allowing considerable additional cooking time. Do not overcook. It is not possible to fry at such low temperatures and without fat (oil).
Please allow no more than 25% of your diet to consist of meats, nuts, eggs, fish, cakes, cookies, candies, breads and other baked goods, and only if you enjoy excellent health. While we do not prohibit the use of red meats, they should be taken infrequently and then in moderation. Be aware that nuts and seeds of all types are sources of mostly fat. They should not be regarded as protein foods. While these are not prohibited foods, they are not part of the primary recommended diet, but rather an allowable addition. The moment your health declines, whether this involves infection, trauma (injury), poisoning, emotional/mental stress, or chronic disease, discontinue most of these marginal foods.
Why, in a world so modern, do we repeat these well worn recommendations? After all, on the strength of clinical observations, these same recommendations were already the accepted dietary wisdom of the Golden Age of German Medicine before WWII, when fruits, vegetables and dairy were called the "protective foods". In the U.S., these guidelines were brought forth in July of 1945, this time as prophylaxis against heart disease and cancer, before the U.S. Senate by the great German-American tuberculosis specialist, Dr. Max Gerson, pioneer of sodium restriction, potassium supplementation, protein-calorie restriction, and dietotherapy based on the protective foods.
Modern epidemiological observations have now confirmed the early 20th century clinical observations of the protective effect of fruits, vegetables, whole grains and dairy. Diets supplying predominantly these foods are inversely correlated to (they protect against) the incidence of our two great modern epidemics: cardiovascular disease and cancer.
The U.S. Senate's McGovern Committee reiterated them in 1977 as U.S. National Dietary Goals. The National Academy of Sciences' (NAS) National Research Council's (NRC) Committee on Diet, Nutrition and Cancer made the same recommendations in their interim dietary guidelines of 1982. The American Cancer Society (ACS) followed suit in 1983, and shortly thereafter the National Cancer Institute (NCI). Subsequently we have seen dozens of books based on these recommendations written by oncologists, cardiologists, physiologists, dietitians, nutritionists, journalists, reporters, and popular authors promising long healthy life without heart disease and cancer.
There is, of course, a direct correlation between food and health. It is nutrition which sustains us, and it is our food which nourishes us or destroys us.
What is nutrition? A good definition is found in Taber's Encyclopedic Medical Dictionary:
"the sum total of the processes involved in the taking in and utilization of food substances by which growth, repair and maintenance of activities in the body as a whole or in any of its parts are accomplished. Nutrition includes ingestion, digestion, absorption, and metabolism".
Nutrition is responsible for repair not only in the rebuilding of damaged tissues, but also in the correction of disease through cell-mediated and humoral immunities. Nutrition is also responsible for maintenance of normal cellular integrity and tissue function, an important aspect of which may be characterized as resistance to disease.
All genuine authorities are now agreed on the relationship of diet, nutrition and health/disease. All informed laymen know it. Only a few sociopathic madmen and industrially sponsored prostitutes-masquerading-as-scientists continue to deny it.
Then why do we repeat these recommendations? Because they are still not a matter of personal practice for the majority of the population. Although many possess an intellectual understanding of these guidelines, mysterious compulsions often act to override our intellects, leading us to consume exactly the wrong foods. This behavior can be observed even, and perhaps most clearly, in the most conscientious of us by auto-experimentation. Or it can be seen by paying close attention to coworkers, friends and family.
People fully knowledgeable of the negative health consequences of chronic food abuse, people who might lecture us regarding the evils of inappropriate diets, will give voice to their intentions to eat a diet fit for the human species and, in the next breath, will order a junk food pizza for dinner and invite their friends to join them. For many putatively healthy and sane adults, junk food consumption is the dominant dietary pattern when graphed over time.
Even if the relative quality of foods consumed is high, if the ratio of protective foods to the rest of the diet is insufficient, deleterious effects will result. Of course, many continually consume far too much high quality, hormone-free, organically fed meat, eggs, cheeses, fats, etc., in spite of knowing full well the high price which must eventually be paid to the piper.
We know of no satisfactory psychological theories or physiological explanations for the failure of our increasingly well-informed intelligent adult population to confront and correct its known suicidal dietary patterns.
But you can be different. You can become nutritionally streetwise and eat toward survival. You can stop worrying about vitamin and mineral pills as well as heart disease and cancer. You can also stop nervously reading labels for Recommended Dietary Allowances (RDAs), which as we'll explain later were never intended to be used by the individual seeking to improve his daily nutrition. All you really have to do is eat according to the original Gerson dietary guidelines which were part of the Congressional Record more than three decades before the printing of "Dietary Goals for the U.S.", and nearly four decades before the adoption of the same guidelines by NCI and ACS.
Not all fruits and vegetables are equally valuable. Methods of growing have an effect on the nutritive quality of foods. This effect, which is probably vastly beyond contemporary estimates, is currently immeasurable with the exception of a narrow group of markers known as nutrients and reflected commonly in the RDA tables.
Warning: Do not expect to find "organically grown" foods in all grocery stores. Purchase only those foods with certification labels clearly stating "organic". Foods grown by inappropriate technologies may actually be directly harmful to your health due to residues and/or metabolites of insecticides, fungicides, herbicides, rodenticides, and growth regulators. Such agricultural inputs frequently result in changes of the chemical composition and, presumably, in the steric (atomic spatial) relationships of molecules within the plants themselves. Thus, a commercially grown fruit which is apparently a beautiful apple may, in fact, be something quite different. Do you remember the story of Snow White?
In this issue, we will provide you with basic information about organic foods, what they are and how they are better than chemically grown foods. We'll look at who is growing them, who is selling them, and we'll provide you with information that will help you locate them. We'll also explain how you, personally, can help us to improve the safety and nutritional quality of the nation's food supply.
That which nourishes me also destroys me. Man's food is his poison. Never before in history has this been so inescapably correct, for now as never before, we have plenty to eat and it is produced with plenty of poison.
What do we know of nutrition? Nutrients are molecular components of foods. They are observable and measurable and serve as markers for the evaluation of whole foods. They are correlated to normal plant growth and to health in humans. Some of them have been shown to prevent specific "deficiency" diseases such as pellagra, kwashiorkor, beriberi, rickets, night blindness, anemia and scurvy.
But there is more to nutrition than the known nutrients.
The erroneous impression has been created that a science exists in which the multiple processes of nutrition are understood. Nutrition has been observed. Some of the key nutrients - some of them - have been identified and extensively studied. These are proteins, fats, carbohydrates, vitamins and minerals. Components of the living organism of man have been similarly studied. However, our studies have just begun.
The marriage of the medical sciences (based in wet chemistry) with particle physics (quantum mechanics) has left us freshly astonished at the foot of a great mountain, facing our basic lack of understanding of the workings of living organisms.
At the subatomic level, man and plant are only vaguely comprehended by us. The actual dynamics of the myriad interactions between these are enigmatic, shrouded and invisible. Oftentimes, we don't even know what we are looking at. Are we perhaps studying the effects of our attempts to observe?
All that we know is gross, mechanical and simplistic. Honesty forces us to admit that every physiological system we have studied and mapped must now be incorporated into a new understanding, into a metasystem, in which, for example, a pancreas is composed of interacting electron shells and a gallbladder's functions relate to its neutrons and mu-mesons and charming quarks.
Suddenly, we find ourselves in an expansive realm where we have to admit that Benveniste's homeopathic experimental antigen reactions produced with water dilutions at the 120th power need not be explicable for them to be real. (If you are unfamiliar with these experiments, please read "The haunting of Nature" below.) Is it so inconceivable that water might "remember", might carry a "homeopathic ghost", when all matter is thought to be made up of energy/mass "wavicles" called quanta which themselves exist only intermittently?
Add to our overwhelming ignorance of the actual workings of life the horrifying knowledge that we are continually manufacturing chemical death messages and spraying them onto our agricultural commodities. These death messages are present at high dilutions in the living water of fruits and vegetables sold to the public. No one knows what they are doing. No one.
The authors have spent considerable time investigating pesticide safety testing, tolerances, residue-monitoring, and protection of the public. We've come to hold some very strong opinions simply stated as follows:
Our foods are poisoned. Fresh fruits, vegetables, and grains grown in this country are saturated with poisons which are capable of producing both acute and long-term negative health effects. Complicating this is the importation of 26% of all fruits and vegetables consumed annually in the United States, foods which are even more thoroughly contaminated than those produced domestically.
Our government Is not protecting us. The supermarket shelves, restaurants, and dinner tables of the United States of America are daily poisoned by an enemy from within. The system used by the Environmental Protection Agency (EPA) to establish so-called "safe" levels of residues is methodologically unsound. Serious flaws in logic stemming from factual errors and incorrect assumptions have propelled EPA to act exactly contrary to its Congressional charter. EPA has failed to remove almost all known disease causing agricultural chemotherapy products from the market and has, this year, unbelievably deregulated previously controlled hazardous agricultural chemicals. What is worse, we have no protection from the responsible regulatory body, the Food and Drug Administration (FDA), an agency as dysfunctional and inept as a chronic alcoholic and as dangerous as a drunken driver.
Pesticides are damaging this nation's health. America's economy is being relentlessly eroded by lost worker productivity and monumentally disproportionate health care costs. Added to this is the tragic economic collapse of the traditional American family farming system, which suffers from both the unanswerable financial challenges and the toxic side effects of long term aggressive agricultural chemotherapy.
Just as our finest physicians are powerless to either diagnose or treat the uncharted, often unrecognized maladies resulting from chronic exposure to agricultural chemicals, our top agricultural scientists are impotent in the face of multi-pesticide-resistant predators, insects and plant diseases.
Far from providing a permanent answer to the need for worldwide supplies of agricultural commodities, conventional farm chemotherapy threatens to kill the patient through disruption of living soil ecosystems, and may very well send the rest of us to the gallows, our bellies full with "the prisoners last meal".
In the context of this newsletter we will provide powerful statements from this nation's elected officials and other leading authoritative critics of conventional farm chemotherapy. You will be privy to a battle being fought in Washington which has been unreported to the American people in one of the most curious media blackouts we at the Gerson Institute have ever seen.
This nation's media are a mix of responsible genius, competence, incompetence, idiocy, and unethical behavior. It is a difficult job to sort out the truth from the propaganda, as often the journalists themselves are relatively innocent and manipulated by apparent authorities.
This is an era in which Commissioner Frank Young of the FDA entered office in 1984 touting the "anti-quack" platform, a "safe" platform to be sure, but one which has no constructive essence. Anti-quackery is a bandwagon easy to hop. Only last year, the Los Angeles Times ran journalist John Hurst's insensitive and stupidly inaccurate "quack trashing" articles, attacking Charlotte Gerson and Dr. Max Gerson. The LA Times refused to print our letters in response to Hurst who was inspired by writers for the National Council Against Health Fraud, a self-promoting group of "quackbashing" grandstanders who seek to make themselves taller by cutting off the heads of alternative practitioners.
This same media mentality has ignored the startling truth about pesticides and the inability of our regulatory agencies to function. Consequently, you will read Congressional testimony in these pages rather than those of the nation's best newspapers.
In addition to the bad news, in this issue we will paint the opposite scenario. We will provide a sound rationale for promoting the growth of an alternate system: an eco-agriculture, a sustainable agriculture, whose most recognizable and supportable form is accessible to the consumer in the rapidly growing infant known as the "organic" farming and food production industry.
And in our next issue we will show that, while much underinvestigated, there is a growing body of evidence which strongly suggests that certain of the organic methods of agriculture can indeed produce foods with measurably higher nutrient contents. Not only is organic food free from poison, but it is more vital, and imparts health as no chemically grown foods can possibly do.
The great Dr. Gerson was unafraid to make strong statements, even when he knew that they would evoke controversy. His language was clear, precise, and unequivocal. It is likely that the combined sciences will soon echo his visionary language of 1958:
"We must conclude from these observations that unless the soil is cared for properly, the depleted soil with its abnormal external metabolism will bring about more and more abnormalities of our internal metabolism, resulting in serious degenerative diseases in animals and human beings. The soil needs activity - the natural cycle of growth; it needs protection from erosion; and finally, it needs less and less artificial fertilizer, but more and more of the use of organic waste material in the correct way, to maintain the soil's productivity and life. Food produced in that way - we have to eat as living substances, partly fresh and partly freshly prepared, for life begets life. Organic gardening food seems to be the answer to the cancer problem."
(Excerpted from the Gerson Healing Newsletter, Vol. 5, No. 1, 1989)
I was asked recently by the editor of a proposed new scholarly quarterly to prepare an article discussing the historical beginnings of the Recommended Dietary Allowances (RDAs) and to compare their contemporary uses to the purposes for which their originators created them. In the process of creating an outline for the piece, I read thousands of pages from hundreds of articles dating from the 1800's through to the present.
RDAs were developed to cope with the changes caused by World War II. Normal food supplies were disrupted, new food supplies were available, large groups of people were being assembled in new locations. They were also created to feed our soldiers and our civilian defense workers the "best" possible nutrition: nutrition not simply to provide essentials for survival, but supernutrition to produce better fighters and a stronger nation.
To do this, RDAs were intended to be used as measures of the quality of whole foods, the "protective foods", fruits, vegetables, whole grains, and dairy, which had been long associated in the medical literature with disease resistance, immunity, and physical prowess. Suitability of new crops for consumption was to be determined by testing samples for known nutritional factors (e.g.; vitamins). This is almost directly analogous to an old time riverboat navigator calling off depth readings. The "go ahead" reading was "Mark Twain". Just as there is much more to a river than the measurement of a point at which its waters are deep enough to navigate, the RDA originators recognized that there is much more to whole foods than the known nutrients.
Furthermore, RDAs were intended to identify nourishing whole foods to be purchased in massive quantities for groups, not for individuals. They were never intended to tell any individual how much of any vitamin should be taken, nor were they intended to provide manufacturers formulae to "enrich" processed foods.
The savy consumer should stop reading labels for "Vitamin content." Food constituents thought to be valuable in the prevention of cancer are not even mentioned in the RDAs. Consumers should eat according to the dietary guidelines offered in this issue of the Healing Newsletter. Enriched manufactured or processed foods will never be the nutritional equivalent of whole foods. Consumers should wisely go to the organic produce section, bypassing the boxed, bagged, and canned foods. Let us not be a nation of mal-nourished, vitamin-wise idiots savants.
(Excerpted from the Gerson Healing Newsletter, Vol. 5, No. 1, 1989)
The U.S. food supply is awash in a sea of pesticide formulations. Some of our crops are so thoroughly and repeatedly drenched with poisons and solvents that they could practically float to produce warehouses like logs down a river of chemicals.
It is a familiar umbrage of doubt and suspicion which I cast on pesticides and their manufacturers. Excellent commentaries on the subject have been recently written by Lawrie Mott and Karen Snyder of the National Resources Defense Council ("Pesticide Alert", 1987), Pete Price of the Assembly Office of Research for the State of California ("The Invisible Diet", 1988), and the Committee on Scientific and Regulatory Issues Underlying Pesticide Use Patterns and Agricultural Innovation of the Board on Agriculture of the National Research Council of the National Academy of Sciences ("Regulating Pesticides in Food: The Delaney Paradox", 1987).
Based on the prior labors of Dr. Max Gerson, M.D., the Gerson Institute's involvement with, and vocal opposition to, chronic pesticide abuse is as old as the pesticide industry itself. Since early in the first half of this century, Gerson advocated organic enrichment of food crop bearing soil and avoidance of chronic chemical applications to food crops. In a 1985 speech before the History Division of the American Chemical Society, Albert Einstein College of Medicine Professor of Surgery and Biochemistry Dr. Eli Seifter recalled Gerson's Senate Testimony of 1945.
In his address, entitled "The Contributions of Dr. Max Gerson to Nutritional Chemistry", professor Seifter reviewed Gerson's advocacy of both the disease preventive and therapeutic use of fresh fruits and vegetables grown without DDT and Chlordane. Gerson also warned that crops treated with pesticides should not be consumed.
At that time, according to Seifter, Gerson was ridiculed by members of the American Cancer Society and the U.S. Public Health Services. However, since that time, the American Cancer Society has adopted Gerson's dietary recommendations (with the notable exception of pesticide avoidance, and without credit to Gerson), and both DDT and Chlordane, now known to be carcinogenic, have been banned for food application in the United States.
If Gerson's early warnings were vindicated, why did our national policy makers not act to prevent further abuses and to protect Americans from other chemical threats? What is the history of the U.S. Government's involvement in the regulation of pest control poisons?
Apparently, the majority of legislators did not view pesticides as a problem. Perhaps they simply accepted the manufacturers' empty assurance, "It washes off".
The U.S. Federal Insecticide Act has been a matter of law since 1910. But it was not designed to protect consumers against contaminated food. Instead, it was intended by Congress to protect farmers against fraudulent promotions of adulterated pesticides. At that time, many arsenic compounds were used which were later proven to have terrible health consequences and were subsequently banned in the U.S.
The concept of residual Chemicals found in the food supply was not a matter of concern in Washington for nearly thirty years.
Although a 1938 Amendment to the Federal Food, Drug, and Cosmetic Act (FDCA) first reflected concern for consumers by addressing tolerance levels for pesticide residues, pesticides were not regulated for consumer protection, for practical purposes, until 1947. The vehicle for regulation which was passed in 1947 was a very weak Federal Insecticide, Fungicide, and Rodenticide Act (FIFRA) which required registration through the U.S. Department of Agriculture (USDA).
FIFRA was so weak that the USDA was impotent. Even if USDA considered an applicant's pesticide hazardous, the manufacturer could obtain a so-called "protest registration" to keep the pesticide on the market. Unbelievably, U.S. taxpayers were obliged to eat probable poisons and to pay for U.S. Government sponsored testing to prove them dangerous before they could be removed from the market.
Sixteen years from the introduction of the concept of food tolerances, the 1954 "Miller Amendment" to FDCA, at last, required FDA to prove pesticides effective and to set tolerances on raw foods.
Public awareness of the problem of pesticides in food was stimulated by the 1962 publication of Rachel Carson's powerful "Silent Spring". Within less than two years, the 1964 Amendments to FIFRA put an end to "protest registration" of hazardous pesticides. Substantial modification of FIFRA also sharply curtailed pesticide manufacturing industries' ability to promulgate chemicals which would injure life forms other than the intended targets.
In 1970, as part of something called "Reorganization Plan #3", the Environmental Protection Agency was put in charge of FIFRA. EPA is still in charge of registering pesticides and setting tolerances.
The Federal Environmental Pesticide Control Act (FEPCA) of 1972 was created under the banner of consumer protection, but actually accomplished quite the opposite. This piece of legislation cast in concrete the abstract, scientifically unsound assumption that chronic pesticide use brought with it a benefit great enough to offset harm to the consumer.
The unfortunate language of FEPCA compels the EPA to register a pesticide if
"when used in accordance with widespread and commonly accepted practice, it will not cause unreasonable adverse effects on man or the environment, taking into account the economic, social and environmental costs and benefits of the use of any pesticide".
Assuming that the diseases caused by pesticides will be birth defects, frank mutations, neurological damage, immune incompetence, and cancer, to name a few, we must ask: When is it "reasonable" to cause these diseases in even one person?
These man-made, one might even say industrially sponsored, and so-called "reasonable" diseases of humankind and the environment are altogether abominable; the more so with our knowledge of the rational and forward thinking return to economically, socially, and environmentally successful low input (read low chemical) sustainable agriculture bellwethered by the unsung heroes of America, our independent farmers.
Scientists are currently unable to predict the carcinogenic, mutagenic, and/or teratogenic risks inherent in chronic exposures to low levels of dozens and dozens of probably interactive chemicals. There are far too many variables. Funding for epidemiology is worse than inadequate, and no one thanks a researcher for doing the work.
But our federal laws command EPA to find that known and suspected dangers of chemicals in our food and environment are balanced by short term gains in limited segments of the economy. Metaphorically, EPA has been ordered to go to Heaven by hopping aboard a Hell-bound hand-basket.
My critics might argue that I am mistaken regarding the legislative intent and effect of FIFRA, so I hasten to point out that FIFRA required EPA to purchase unsafe pesticides in order to remove them from the market. EPA has compensated offending manufacturers with at least $20 million already. Would a Congress interested in protecting the consumer have forced taxpayers to support the manufacture of suspected poisons?
This practice would have continued had not the recent Congress moved to place the majority of financial burden on the chemical manufacturers instead of the taxpayer. In late 1988, Congress amended FIFRA to require manufacturers to contribute to the toxicological evaluation of - their chemicals which had gained registration before current testing criteria had been developed. Under the new laW, firms will be assessed fees from $50 thousand up to $150 thousand.
The 1988 legislation also established a nine year deadline for completion by EPA of reviews and evaluation of toxic health risks of pesticides, some of which have been in use for decades now. In 1972, EPA was ordered to review and evaluate some 400 active pesticide ingredients. None of those studies have been completed as of the date of publication of this issue of Healing.
The apparent progress of the above legislation was dealt a stunning setback on October 12, 1988, when the EPA announced an end to a 30-year ban on carcinogenic pesticides known to concentrate in juicing and cooking of fruits and vegetables. EPA's rationale for this anti-consumer/pro-industry move was that it had adopted a "negligible risk" policy developed by the National Academy of Sciences.
In this writer's opinion, EPA is wrong to characterize the "negligible risk" scenario of NAS as a scientific recommendation. EPA chose one of four scenarios NAS offered in an attempt to consider both the purely scientific issues involved in chronic pesticide use and the confusing socioeconomic concept of "balancing" human health risks against perceived economic benefits.
The four NAS scenarios depicted a range of options which included, allow me to stress this, a complete ban of all oncogenic chemical applications to food. EPA was free to choose that option, and a similar "zero-risk" scenario which focused on residues in processed foods. NAS did not, and could not, tell EPA what to do. EPA's directors decided to deregulate carcinogenic pesticides.
But that is where we stand today. Chemicals have been sanctioned by the U.S. Government at levels considered unreasonable and unsafe by many experts. That is not to say that there is harmony in the government regarding these issues.
The fur is flying at EPA and FDA. During April of 1987, the powerful Chairman John Dingell of the U.S. House of Representatives' Energy and Commerce Committee (which controls the budgets for the National Institutes of Health) held grueling hearings into what Dingell characterized as "serious deficiencies in the Federal pesticide monitoring program". The hearings were held by the Energy and Commerce Subcommittee on Oversight and Investigations. Representatives' Waxman, Sikorski, Wyden and others joined the Hon. Mr. Dingell, who also chairs the Subcommittee, in a roast of the FDA and its Commissioner Frank Young.
Why has the national press remained silent on these investigations? We are certain that our readers will want to know what is being said and done, and by whom. So, we are certain, should readers of the New York Times, the Washington Post, the LA Times, the Des Moines Register, and others. Readers, why not write your local press corps and inquire regarding their lack of knowledge/interest in this subject? Perhaps you might stimulate them to look into it.
As the hearings opened, the Honorable Mr. Henry Waxman, U.S. Representative from California, spoke pointedly saying, "The American people want to believe that our food, whether produced here or abroad, is free from unsafe pesticide residues. They want to believe that our Government is doing all that is necessary to protect them. The record compiled to date by EPA and FDA leaves me with little confidence that the public is getting what it wants and deserves. The most generous characterization of our current situation is, simply put, we just don't know if our food is safe."
"How can we be in this intolerable predicament? The Federal Food, Drug, and Cosmetic Act mandates that EPA allow pesticide residues to remain on food only if they are safe to consume. Yet, according to testimony by EPA before the Subcommittee on Health and Environment last summer, EPA has complete scientific data for approximately 10 percent of the food-use pesticides currently being applied to our crops. Most pesticides still face years of additional testing before EPA will have the necessary data to make a regulatory decision."
"In addition, EPA can only speculate about the safety of many of the inactive ingredients used in pesticides and about the metabolites and breakdown products of the currently used active ingredients. The bottom line is that EPA approved pesticide residue levels are outdated and unsupported by scientific data. Yet, farmers apply pesticides every day with the intention of staying within these EPA regulatory limits."
"To make a bad situation even worse, we can only hope that our food contains no more than the EPA-set residue levels because the FDA cannot tell us with certainty that our food meets even the inadequate EPA standards."
The Honorable Ron Wyden, U.S. Representative from Oregon, observed in his opening statements that "(T)he U.S. system for inspecting food is a non-system. Imported foods tainted with dangerous pesticides slip by the Food and Drug Administration because virtually none of this food is tested. Rather than protecting the American public, our food inspection system forces Americans to play Russian roulette at the grocery store. All too often, adulterated food is permitted on the shelves of our supermarkets before Food and Drug Administration test results are in."
"When imported food arrives in this country, the Food and Drug Administration inspectors don't sample a fair cross section of that food. Many pesticides found on foods from major exporting countries have been banned or considered serious health hazards in this country. These toxic chemicals have often been overlooked by the Food and Drug Administration."
"The inspectors tend to focus on high volume foods, leaving the low volume foods unexamined. For example, in fiscal years 1983 through 1985, 46 million pounds of raspberries entered our ports and only two samples were collected; 251 million pounds of yams were imported into this country and only 24 samples were taken."
"By the time the Food and Drug Administration discovers a violation, the food usually has been eaten. The FDA doesn't fine the importers and can't fine the growers."
"Who loses in the Russian roulette game? Obviously, the consumer, but often the American farmer, who has to compete against foreign growers who use those chemicals banned in this country."
The most colorful and effective opening remarks were made by the gifted and Honorable Gerry Sikorski, U.S. Representative from Minnesota: "During the last 15 or 20 years, we have learned a great deal about dangerous chemicals in the foods we eat and the beverages we drink. We have had cancer-causing cyclamates in diet soda, EDB's in cake mixes, sulfites in our salad bars, and red dye No. 2 in crimson M&M's."
"The result of all this knowledge has been, or so we thought, a safer diet. Some additives have been banned. Although some dubious ones remained on the market, at least we could act as informed consumers, knowing what foods to avoid. We could always go natural, to fruits and vegetables and such."
"It's spring, and we are pulling out the picnic baskets and, as surely as summer follows spring, a sequel to `Jaws' follows the Sports Illustrated swimsuit edition. And now, just when we thought it was safe to go back into the grocery store, it turns out that the safest waters, our fresh fruits and vegetables, have become infested with angry chemical sharks."
"Our regulatory lifeguard, the FDA, has known about the presence of these chemicals in imported foods for many years. The American consumer remains an unwary swimmer. We have a pesticide suspected of causing gene mutations, cancer, and birth defects, benomyl, in bananas, ..."
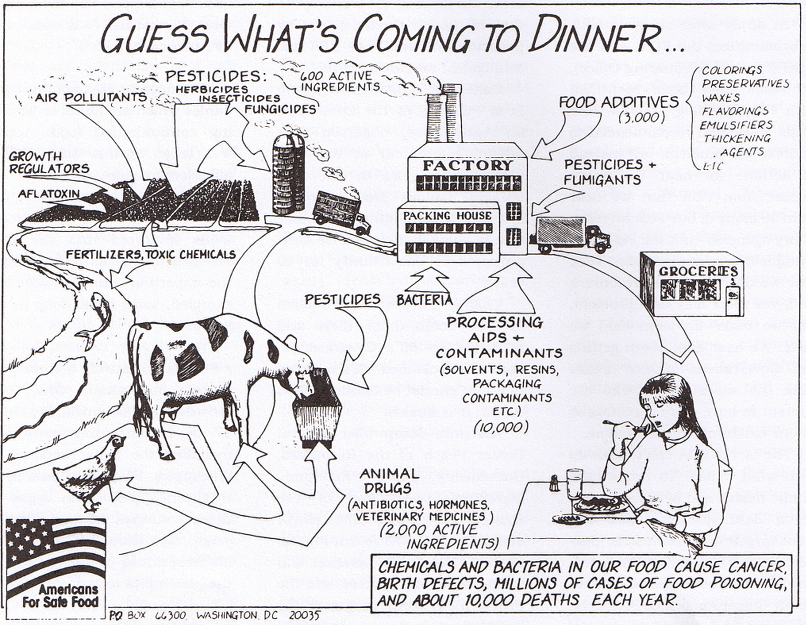
Observation: Page 71 is missing in the pdf original.
health risks associated with many pesticides.
Accompanying Mr. Peach was National Resources Defense Council Senior Scientist, Lawrie Mott. Along with colleague Karen Snyder, Ms. Mott written "Pesticide Alert" which was published last year. Ms. Mott is a molecular biochemist, trained at Yale University.
In her testimony Ms. Mott explained, "Often tolerances are established (by EPA) without sufficient toxicological data to assure that the levels chosen are safe for human exposure. In some cases when data do exist, they are inadequate, invalid, or even fabricated."
"Further, when developing tolerances EPA has relied on arbitrary assumptions about what constitutes an average diet, and what safety factors should be used. Tolerances are rarely revised when new scientific information is received about a pesticide. Inert ingredients and other chemicals of toxicological concerns such as metabolites or break-down products that may leave residues in food are not considered in tolerances."
"Many pesticide tolerances were established without information on the chemical's potential to cause cancer, birth defects, sterility or genetic mutation. For example, by the end of fiscal year 1985, EPA had reviewed tolerances for 117 active ingredients through their registration standards program. Only four registration standards identified tolerances as adequate and fully supported by the necessary health and safety data. Fourteen registration standards revealed that the public's maximum potential exposure to the pesticide in food may exceed the amount considered safe to ingest."
"For instance, EPA calculated that the maximum potential dietary exposure to the insecticide lindane exceeds the acceptable daily intake by 7,883 percent. Forchlorpyrifos, ethion and endosulfan, pesticides found commonly in food, the potential human exposure exceeded the acceptable daily intake by 313 percent, 258 percent, and 140 percent, respectively."
"For 23 other chemicals, the registration standards indicated that EPA had insufficient data to determine the amount of residues considered safe to ingest. Nonetheless, these chemicals are continuing to be used on food."
"Another issue rendering EPA's tolerance setting system ineffective is the complete failure to regulate the inert ingredients contained in pesticide products."
"Recently, EPA reviewed the 1,200 commonly used inerts to identify the chemicals of toxicological concern. As a result, the Agency developed two lists of approximately 100 inert ingredients that present human health risks."
"List one contained inerts of toxicological concern, and list two contained the inerts that are potentially toxic based on structural similarities to compounds already known to be hazardous."
"(The National Resources Defense Council) has learned that at least 30 of these pernicious inerts have received exemptions from tolerances ... These exempted chemicals that may be occurring as residues in our food include the carcinogens benzene, epichlorohydrin, formaldehyde, methylene chloride, and vinyl chloride."
"At best, FDA's five scans can cumulatively detect approximately 40 percent of the chemicals that may leave residues in our food. Some of these chemicals that cannot be detected include the dangerous pesticides benomyl, daminozide, the EBDC's, paraquat, DBCP, and dinoseb. In fact, approximately 40 percent of all the pesticides classified by FDA as having a moderate to high health hazard cannot be detected by any of the five multiresidue scans."
Ms. Mott stated strongly a point with which the Gerson Institute fully agrees, "Due to the numerous weaknesses in EPA's tolerances that I discussed earlier, the public cannot assume that only residues in excess of tolerances are dangerous. Between the fiscal years 1982 and 1985. FDA analyzed approximately 20,000 samples of 26 kinds of commonly consumed fruits and vegetables. Pesticide residues were detected in 48 percent of all the foods monitored. And this number probably understates the extent of pesticide residues in our food because the FDA's routine methods for detecting chemicals only detect about half of the chemicals used on our foods."
One particularly revealing moment occurred during an exchange between Rep. Wyden and Mr. Kevin Donohue, group director from GAO. Rep. Wyden had asked whether there were holes in the Total Diet Study, or Market Basket Study.
In 1983, FDA Associate Commissioner Joseph Hile had haled it as "effective in showing over the years that the American consumer's dietary exposure to pesticide residues has been consistently below acceptable limits of exposure set by the World Health Organization". After issuance of a critical GAO report in 1986, Secretary Bowen claimed that the Total Diet Study showed that "the U.S. consumer is not being exposed to harmful levels of pesticide residues".
Mr. Donohue responded: "What they do in the Total Diet Study is that they take a market basket from various grocery stores in different parts of the country. This is done four times a year in four different parts of the country. Then they run the food through a series of tests. From the information available to us, the same problems we found in FDA's pesticide monitoring program exist in the Total Diet Study. That is, heavy reliance on the multiresidue test."
"For instance, the records according to FDA files, show that the EBDC is not tested in the Total Diet Study."
"One of the other things is that they have made some improvements since 1979. At that time, they were targeting three age groups. Currently they are targeting eight. For instance, maybe the majority of the people on the subcommittee today are not covered by that. In other words, the category of people 31 to 59 is not covered."
Rep. Wyden asked, "Am I to understand that the coverage of the Total Diet Study excludes the high health hazard pesticides which are not covered by multiresidue methods, such as the EBDC's?"
"That's right," said Mr. Donohue, "they have not tested EBDC's at all."
Rep. Sikorski, the colorful speaker who had earlier displayed tomatoes and bananas, offered an important observation, "I think it's important to remember that what we're talking about are not things that show up on the outside. If you peel this banana, you're not free from the problem. It's in the actual meat. When you peel the banana, you're just getting to the problem. When you eat the tomato, you can wash it in the sink, which you should do, but we're talking about systemic compounds whose residues are within the food itself."
Shortly afterward, biochemist Mott added, "(S)ome chemicals will penetrate, no matter how they are applied, they will translocate. Other chemicals, if you apply them late in the growing season, will only be on the surface, whereas if you apply them in the early season they will penetrate the entire fruit."
"The other problem is that even if the residues are limited to the surface, many chemicals are designed not to be water-soluble, because (pesticide manufacturers) don't want them to wash off the plant in the field. (They) want to have the effect on the target. So washing won't even remove residues that may be limited to the surface."
"What consumers should do is they should try to buy locally grown produce in season. They may want to avoid food that is shipped great distances that could have been treated to prevent spoilage during travel. And also, I would recommend that consumers ask their supermarkets if they can stock organically grown food."
"For example, all 125 Safeway stores in the United Kingdom sell organically grown produce. There is organically grown produce available in varying degrees throughout our Nation, and the food industry should consider marketing it along with commercial produce."
The Gerson Institute joins with the National Resources Defense Council in urging consumers to purchase organically grown foods. Consumers should step out of the role of the unwitting or unwilling victim. Stop relying on the U.S. Government to force the pesticide industry to change. We must make the changes ourselves. The U.S. government must follow the will of the people. And industry cannot sell chemically grown and poisonous produce to people who will not buy it. Don't buy it!
ACTIVE INGREDIENT: An ingredient in a pesticide product that destroys or controls a pest.
CARCINOGEN: A substance or mixture of substances that produces or incites cancer in a living tissue.
FUNGICIDE: Chemicals used to kill or suppress the growth of all fungi or a certain fungus (mushrooms, molds, mildews, rusts, etc).
HERBICIDE: A class of pesticide used to kill or suppress the growth of all or a certain type of plant.
ILLEGAL RESIDUE: The presence of an active ingredient in ammounts above the tolerance on a crop at harvest. In some cases, any amount of chemical present on the crop is considered illegal if no tolerance exists for the pesticide on the commodity.
INERT INGREDIENT: A substance contained in a pesticide product or formulation that is not intended to kill or control the target pest but rather used to dissolve, dilute, propel, or stabilize the active ingredient in the pesticide product.
INSECTICIDE: A class of pesticide that prevents, destroys, repels or mitigates insects.
MUTAGEN: A substance or agent that produces genetic changes in living cells.
ONCOGENICITY: The tendency for the development of tumors in organisms exposed to a chemical substance.
PERSISTENT PESTICIDES: Pesticides that remain in the environment and do not degrade or metabolize to innocuous constituents for months or perhaps years.
PESTICIDE: A general term for chemical or biological products used to destroy pests; (unwanted) insects, plants, fungi, rodents, bacteria, or other organisms.
REGISTRATION: Licenses for specified uses of pesticide products. A pesticide product registration sets the terms and conditions of the use that the product, including the directions and precautions for use outlined on the product label. All pesticides must be registered by EPA before they can be sold to the public.
REREGISTRATION: A reassessment of previously registered pesticides according to current scientific standards.
SYNERGISM: The tendency of chemicals acting in combination to produce effects greater than the sum of the effects of the individual chemicals.
TOLERANCE: The maximum amount of pesticide residue that is legally permitted in a food. EPA sets a distinct residue limit for each individual food to which the pesticide may be applied.
TOXICITY: The harmful effects produced by a chemical.
The Coffee Enema: What does it do? How does it work?
(Excerpted from the Gerson Healing Newsletter #13, May-June 1989)
It is difficult to describe the incredulous facial expressions which ripple across a medical school lecture audience as the topic of coffee enemas is introduced. Embarrassed sniggering is heard from several seats in the hall.
A wise guy heckles, "How do you take it?" Charlotte Gerson doesn't miss a beat, answering "Black - without cream and sugar." Laughter relaxes the entire room and Gerson goes on to explain this aspect of her famous father's (Max Gerson, M.D.) treatment: 3 tablespoons of drip-grind coffee, boiled in a quart of distilled water for 3 minutes, covered and simmered for 15 minutes, cooled to body temperature, filtered, and admitted to the colon using a 6-8" tip while lying on the right side. This is held for 12-15 minutes and released.
Responses from the audience are typical: "Boy, I'll bet you get a buzz out of that!" "Couldn't you just drink three or four cups of coffee?" I
And the eventual "big question" is "What does it do?" "Why go to all that trouble just for a caffeine high?"
The coffee enema is, without question, the most unusual part of Gerson's combined regime [1], and often evokes astonishment and mirth in persons who have never experienced an enema and who emphatically prefer to drink their coffee. Practitioners and patients who have had experience with coffee enemas, however, know that they are far more than a means of introducing stimulating caffeine into the bloodstream. From the patient's point of view, the coffee enema means relief from depression, confusion, general nervous tension, many allergy related symptoms and, most importantly, relief from severe pain.
In 1981, writing in Medical Hypotheses [2], Mark F. McCarty pointed out that:
"At a Senate Select Subcommittee hearing on cancer research in 1946 [3], five independent M.D.s who had had personal experience with patients treated by Gerson, submitted letters indicating that they had been surprised and encouraged by the results they had seen, and urged a widespread trial of the method [4]. One of these doctors claimed that relief of severe pain was achieved in about 90% of cases. No controlled trial of Gerson's methods has ever been undertaken."
The coffee enema has a very specific purpose: lowering serum toxins. Dr. Peter Lechner, who conducted a trial of the Gerson cancer therapy in the post-surgical treatment of liver-metastasized colorectal cancers under the aegis of the Landes-krankenhaus of Graz, Austria, reported [5] in 1984:
"Coffee enemas have a definite effect on the colon which can be observed with an endoscope. Wattenberg and coworkers were able to prove in 1981 that the palmitic acid found in coffee promotes the activity of glutathione S-transferase and other ligands by manyfold times above the norm. It is this enzyme group which is responsible primarily for the conjugation of free electrophile radicals which the gall bladder will then release."
The importance of this action of coffee enemas is best described against the background of modern concepts of cell ion and water content.
In most, probably all, Chronic degenerative diseases there exists a "tissue damage syndrome" first described by Cope [6]. When cells are challenged by poison, oxygen starvation, malnutrition, or trauma (a physical blow), a uniform set of reactions takes place: cells a) lose potassium, b) accept excess sodium and chloride, and c) swell with excess water.
According to the work of Ling, recently summarized in his monograph "In Search of the Physical Basis of Life" (Ling, G.N., Plenum Press, New York, 1984), the cellular cytoplasm is latticed with a protein-lipid macromolecule through which an electron current flows. Energy-storing adenosine triphosphate (ATP), the main product of metabolism, is complexed with this macromolecule, polarizing and energizing it, and forming many interactive, cooperative association sites which prefer potassium over sodium.
In a resting, healthy cell with sufficient ATP, water is highly organized in polarized multiple layers forming an "ice-like" structure. Water and ice are different not because their molecules are different, but because their molecules relate differently.
According to Ling's Association-Induction Hypothesis, being "alive" requires not only the presence of the right composition of chemical compounds, but also requires that they be maintained in special electronic and steric (atomic spatial) relationships. The living state is a high energy state in the same sense as a cocked gun, a drawn bow, or a set mousetrap.
In the living cell, potassium and nearly all water (except that in vacuoles, etc.) is in an adsorbed state. Potassium is preferentially adsorbed on the beta- and gamma-carboxyl groups of certain cellular proteins while water is adsorbed in polarized multilayers on a matrix of extended protein chains. Low levels of sodium in the cell are due to the reduced solubility of structured water. This mechanism also contains water content.
Cope reasoned that challenge to the cell by toxins, oxygen starvation, malnutrition, or trauma will result in an altered molecular configuration state in which the macromolecule will lose its preference for potassium. Sodium competes with potassium for association sites in damaged cells.
Loss of cell potassium and increase of cell sodium in turn results in decreased electron flow through the macromolecule. This in turn causes decreased attraction of paramagnetic ions and subsequent disorganization of water molecules. Because bulk phase water, structured in a high-energy state, is the main mechanism controlling cell water content and purity, any disturbance in water structuring will result in the cell swelling with excess water and extracellular solutes.
Once the internal environment of the cell is polluted with excess water and extracellular materials, mitochondrial production of ATP is greatly impaired with the result that cells cannot produce sufficient energy to repair themselves unless the challenge is removed.
Endogenous serum toxins can be generated by cells with impaired metabolism, by bacteria, and by malignant cells. NMR studies have suggested that surrounding active malignancies there may often be a sphere of damaged normal tissue in which water structuring is impaired by the chronic insult of tumor toxins. Energy production and immunity are depressed in these cells which are swollen with excess salt and water. Such damaged tissue has decreased circulation because oversized edematous cells crowd arterioles, capillaries, and lymph ducts.
Gerson taught that improved circulation and tissue integrity would prevent spread and, in fact, cause the destruction of malignant tumors. He held as axiomatic the observation that no cancer could exist in normal metabolism. A favorite example of his was the well known resistance of healthy lab models to tumor transplants. Such transplanted tumors are quickly killed in many cases by inflammation in the healthy host. In order to cause transplanted tumors to "take" easily, it is necessary to impair the metabolism of the host by damaging the thyroid and adrenal glands. Gerson's efforts were directed toward creating a near normal metabolism in tissues surrounding tumors.
Such protective liver and gut enzyme systems are probably enhanced many fold by coffee enemas. Editors of Physiological Chemistry and Physics stated [7]
"Caffeine enemas cause dilation of bile ducts, which facilitates excretion of toxic cancer breakdown products by the liver and dialysis of toxic products from blood across the coionic wall."
Enzyme systems in the liver and small bowel are responsible for conversion and neutralization of the most common tissue toxins, polyamines, ammonia, toxic-bound nitrogen, and electrophiles, all of which can cause cell and membrane damage.
In the late 1970's and early 1980s, researchers in the lab of Lee Wattenberg ([8],[9],[10],[11],[12],[13]) identified salts of palmitic acids (kahweol and cafestol palmitate) in coffee as potent enhancers of glutathione S-transferase, a major detoxification system that catalyzes the binding of a vast variety of electrophiles from the blood stream to the sulfhydryl group of glutathione. Because the reactive ultimate carcinogenic forms of chemicals are electrophiles, the glutathione S-transferase system must be regarded as an important mechanism for carcinogen detoxification. In mice, this system is enhanced 600% in the liver and 700% in the small bowel when coffee beans are added to their diet. Because this system in lab models is close, if not directly analogous, to that of humans a parallel stimulation by coffee of glutathione S-transferase in humans is probable.
With this rationale in mind, we can expand on Gerson's hypothesized physiological actions and effects of coffee enemas. Gerson wrote that Heubner and Meyer of Geottingen University, Germany, had shown in animal models that rectal administration of caffeine would dilate bile ducts and promote bile flow. The introduction of a quart of coffee solution into the colon will dilute portal blood and, subsequently, the bile. Theophylline and theobromine, major constituents of coffee, dilate blood vessels and counter inflammation of the gut. The palmitates of coffee enhance glutathione S-transferase which is responsible for the removal of many toxic radicals from serum. Finally, the fluid of the enema itself stimulates the visceral nervous system promoting peristalsis and the transit of diluted toxic bile from the duodenum out the rectum. Because the stimulating enema is retained for 15 minutes, and because all the blood in the body passes through the liver nearly every three minutes, these enemas represent a form of dialysis of blood across the gut wall.
It is obvious in light of the above that oral administration of beverage coffee cannot have the same effect. On the contrary, it virtually insures reabsorption of toxic bile.
As a medication, the coffee enema is in a class by itself. While other agents classed as choleretics do increase bile flow from the liver, they do little to enhance detoxifying enzyme systems, and they do not ensure the passage of bile from the intestines out the rectum. Bile is normally reabsorbed up to 9 or 10 times before working its way out the intestines in feces. The enzyme enhancing ability of the coffee enema is unique among choleretics. Because it does not allow reabsorption of toxic bile by the liver across the gut wall, it is an entirely effective means of detoxifying the blood stream through existing enzyme systems in the liver and small bowel. Because clinical practice has shown coffee enemas to be well tolerated by patients when used as frequently as every four hours, the coffee enema may be classed as the only non-reabsorbed, effective, repeatable choleretic in the medical literature.
These enemas are safe when used within the context of the combined regime of Gerson. It is apparent that Gerson's intention in supplying a sodium restricted, high potassium, high micronutrient dietary of fruits, vegetables, and whole grains, was to supply all nutrients, known and unknown, which are necessary for cell respiration and energy production. High potassium, low sodium environments tend to return cell macromolecules to normal configuration states and to improve water structuring and water content. The addition by Gerson of supplemental salts of potassium (acetate, gluconate, and phosphate monobasic) to the diet in which malate is supplied by frequent use of apples probably greatly improves the efficiency of the Kreb's cycle in mitochondrial energy production. Protein restriction, employed by Gerson as a temporary aspect of treatment, has been observed empirically since before the turn of the century to aid in the reduction of cellular edema. Administration of high loading dosages of thyroid and Lugol's solution (iodine and potassium iodide in dilute solution) probably result in multiplication of mitochondria, which have their own DNA and RNA and replicate independently of the cell. Additionally, thyroid is known to enhance cell oxidation of sugars and therefore ATP production. In this way cell energy production is probably markedly increased.
Through these mechanisms, the therapy of Dr. Max Gerson appears to a) reduce serum toxins to eliminate chronic challenge to damaged normal cells, b) improve cell potassium ion content, c) reduce cell sodium content, d) reduce cell swelling through improved water structuring, e) increase cell mitochondria count and activity, and f) supply micronutrients necessary for cell energy production and repair. The contribution of low serum toxin levels by regular administration of coffee enemas is basic to increased cell energy production, enhanced tissue integrity, improved circulation, improved immunity, and improved tissue repair and regeneration which have been observed clinically to result from the administration of the combined regime of Gerson.
These recipes were compiled and edited by Christeene Lindsay-Hildenbrand. To be used in conjunction with the Gerson Therapy videotape: "Charlotte Gerson Demonstrates Basic Gerson Food Preparation."
NOTE: Recipes marked with * were contributed by Yvonne Nienstadt, Director of Health Services at Cal-a-Vie, Vista, California. Recipes marked with + were contributed by Susan DeSimone of the Gerson Institute. Recipes marked with MZ were contributed by Marisol Zuniga of the Hospital Meridien. Recipes marked with GSG were contributed by the Gerson Support Group, England. Recipes marked DAIRY contain restricted dairy ingredients, instructions on pg. 98 should be followed carefully.
Use only certified organically grown fruits, dried fruits, vegetables, grains and sweeteners.
Use fresh fruits and vegetables - no canned.
Fruits and vegetables should not be peeled or scraped unless indicated.
To clean them use only lukewarm water and brush.
Gerson approved light honey, maple syrup and sugar. Dried organic cane sugar (SucanatC) may be used in recipes calling for brown sugar. It has a strong molasses flavor. Some cooks may prefer other options.
For 1 person use a 4-quart pot, use the following vegetables, then cover with distilled water:
Do not peel any of these vegetables; just wash and scrub them well and cut them coarsely; simmer them slowly for 2 hours, then put through food mill in small portions; scarcely any fibers should be left. Vary the amount of water used for cooking according to taste and desired consistency. Keep well covered in refrigerator no longer than 2 days. Warm up as much as needed each time.
Note: For recipes which call for soup stock use the liquid from this special soup.
Always freshly prepared. It is impossible to prepare all juices for the day in the morning.


Of the various kinds of leaves mentioned below, procure as many as possible (no others):
Add one medium apple for each glass when grinding.
(A Cancer Therapy, pg. 240)

Squeeze only with a reamer type juicer made of glass, plastic, porcelain. Do not use any juice press into which the orange is inserted with the skin (if the skin is also pressed out, it will emit harmful fatty acids and aromatic substances contained in its surface). Do not use an aluminum juicer.
Use a separate grinder and a separate press. Do not use liquifiers, centrifuges, juice mixers or masters, etc.
Take 1 or 2 coarsely woven cloths, nylon - 12" square, place cupful of pulp into center of moistened cloth, fold in thirds in both directions and press.
Rinse cloths in cool water after each juice preparation. Do not allow juice to dry on the cloths. Wash thoroughly each night in warm or hot water; rinse thoroughly. Keep overnight in freezer. It is most important to clean machine and cloths very well.
If juice retains taste of cloth, use a new cloth. Allow 2 cloths per juice. Have 1 set of cloths for each type of juice. Leftovers of all pressings can be used only for compost or as animal food. If the patient goes to work again, apple and carrot juice only may be taken and kept in a thermos for no longer than 4 hours.
Raw fruit or raw vegetables, when finely grated or shredded, must be used fresh, as quickly as possible. Raw living tissues may not be stored after any kind of preparation. - A Cancer Therapy, pg. 189
The following vegetables are very important (finely grated if necessary, or chopped, mixed or separate):
Buttermilk Dressing*DAIRY, PG. 98
Hand beat or buzz in blender until smooth. Leftover dressing may be kept in a tightly covered jar in the refrigerator for 48 hours.
Mix ingredients together, allow time for flavors to mingle, and serve on salad.
Mix these basic ingredients together and add some or all of the following (optional) and leave to infuse:
Blend all ingredients in Osterizer. Makes 1 pint of zesty and sweet dressing.
Variation: Substitute juice of 1 Lime or Lemon for Orange Juice; increase Water. Substitute Sage or Thyme for Dill.
Spinach Dressing*DAIRY, PG. 98
Yoguefort DressingDAIRY, PG. 98
Blend the first 5 ingredients in blender until smooth. Add herbs and chives. To thin mixture, add more yogurt. Chill before serving.
Summer Cole Slaw+DAIRY, PG. 98
Combine all ingredients in bowl and toss well. Serve chilled.
Wash the artichokes well and boil in covered pot for 45 minutes to 1 hour. When ready, peel them until you can see the center. Remove the "chokes" with a spoon and discard. Cut the artichoke heart and other vegetables into bite size pieces. Combine and toss with vinegar and oil.
Layer each ingredient in a glass pyrex baking dish. Bake at 350 degrees Fahrenheit until tender. Cool and add flax seed oil to taste when cool enough.
Remove loose roots from 2 Celery Knobs and scrub clean. Boil knobs in jacket about 1 hour, peel and slice
Toss with herb or Garlic-Onion salad dressing.
Cold Broccoli Salad*DAIRY, PG. 98
Cut broccoli into bite-sized pieces. Stew over a low flame in a heavy pan with a tight fitting cover until barely tender, about 25-30 minutes. Chill.
Combine broccoli, tomatoes, and shallots in bowl. Mix in dressing. Serve on bed of Endive and garnish with Chives and Parsley
Bake eggplant for one hour at 350 degrees (180 degrees Celsius)
Let eggplant cool, then chop into bite
Soak dried figs and apricots in bowl of water overnight. The next day, empty water and add finely shredded cabbage, coarsely grated carrots and apples, and raisins. In a separate bowl, combine yogurt, lemon juice, and parsley. Combine contents of each bowl and toss together until well mixed. Serve chilled.
Wash and cut up all vegetables, then toss with herb or garlic-onion salad dressing.
Dress with lemon and garlic dressing: equal parts lemon juice and water. Add a little brown sugar (sucanat) and crushed garlic.
Boil potatoes until soft (1 hour) in jackets, peel and slice
Boil the potatoes in their jackets, with the laurel leaves on slow heat. Cut the vegetables and sauté with the apple cider vinegar (can use wok). No oil! Once the potatoes are cooked, peel, cut into small cubes and add the cooked vegetables. Add the flax seed oil after mixture is cooled.
Mix cooked, organic, brown rice (with bay leaf and a little rosemary) with plenty of chopped vegetables - tomatoes, celery, zucchini, radishes, fresh garden herbs and lemon and garlic dressing (see above).
Rose, borage and/or marigold petals look beautiful sprinkled over the salad. Add apricots which have been soaked in water and chopped (if desired).
Grate by putting through grinder of Norwalk:
Combine ingredients and serve with spinach dressing
Sunchoke (Jerusalem Artichoke) Salad
Dress with lemon juice and crushed garlic, fresh herbs and chopped celery leaves. Add flax oil to taste.
Boil Beets in Water for 1 hour. Peel and cut tips off, slice thin. Add Chopped Onions and either Herb or Garlic-Onion salad dressing.
All vegetables must be cooked slowly, over low flame, with little or no addition of water. The slow cooking process is very important, in order to preserve the natural flavor of the vegetables and keep them easily digestible. All vegetables should be "done" or tender. Valuable components are lost in fast cooking by excessive heat, because the cells burst, the minerals go out of their colloidal composition and become more difficult to be absorbed. A stainless steel "flame tamer" may be used to prevent burning. A little of the "Special Soup" may also be used, or tomatoes, apple slices, or chopped onion may be placed at the bottom of the pan to give up more fluid. In some cases this also improves the flavor. Only spinach water is too bitter, contains too much oxalic acid and must be discarded. Tomatoes, leeks, zucchini and onions should be stewed in their own juices, as they contain an abundance of fluid by themselves. Red beets should be cooked like potatoes, in their peel, in water. All vegetables must be carefully washed and cleaned. Peeling or scraping is forbidden, because important mineral salts and vitamins are deposited directly under the skin. The pot (not aluminum) must close tightly, to prevent escape of steam. Don't use pressure cooking pots. Lids must be heavy and fit well into the pots. Cooked foods (soup and fruit) may be kept in the refrigerator for 48 hours.
Baked vegetables should be slow cooked in a "low" oven (180-190 degrees, use oven thermometer) for 2 to 2 and 1/2 hours, in a covered casserole with a tightly fitting lid. This method of baking is virtually waterless. Use onions, tomatoes, or sprinkle vegetables with lemon to add moisture when necessary.
Stewed vegetables are cooked in a heavy pot with tightly fitting lid on top of the stove over a low flame, slowly with little or no added liquid.
Simmered vegetables are cooked on the top of the stove over a low flame in a tightly covered pan with a small amount of liquid. The temperature is kept just at the boiling point.
Boiled vegetables (like corn and artichokes) are cooked on the top of the stove in a heavy pot with a tightly fitting lid. Place 1 inch of cold water in the bottom of the pot, add the washed vegetables (do not peel or scrape), cover. Cook over medium heat, slowly bringing the liquid to a boil (bubbles breaking on the surface and steam given off). Lower the flame as much as possible, keeping the liquid boiling. Note: Bring liquids to a boil only if the recipe specifically calls for it.
"Tightly Fitting Lids": saucepans must be tightly covered to prevent steam from escaping. Covers must be heavy and close fitting. You may have to place wax paper under the lid to aid the seal.

Cut ends and rinse in the center Bring 2 inches of water to a boil Add Artichokes. Lower temperature, cover and simmer for approximately 1 hour. Serve with salad dressing on the side as a dip.

Bake in covered casserole with a small amount of soup stock or lemon juice in low oven 1 hour or simmer with 1/2" soup stock for 30 minutes or until tender.
Run all the vegetables through your grinder and add the water and bay leaves. Cook for 30 minutes on low heat. Serve with a dab of non-fat yogurt.
Bake or boil beets in their jackets.
Scrub 9 beets and boil in 1" water until tender, approx. 1 to t 1/2 hours. Peel in cold water. Slice or cut into bit sized pieces.
Cook over low flame until thick. Add Beets and mix well. Variation: Use 1/2 cup apple juice and 3 tsp. lemon juice in place of orange juice.
Beets, Cooked & "Creamed"DAIRY
Put cooked, chopped beets into a saucepan with the yogurt, chives and onion and heat gently. Put into serving dish and sprinkle with chopped parsley.

Bake in a covered casserole in low oven with onions or a small amount of soup stock for 1-2 hours. Serve with tomato sauce.
Wash broccoli and peal stems. Put garlic and onion in one pot and cook until onion becomes translucent. Add cut broccoli crowns and stems, dill and broth. Cook on low heat until broccoli is tender.
Select dark green bunch of broccoli with no yellowing. Wash well and cut into spears, peeling tougher stalks at base. Place onion, and garlic in pot. Cover and stew on low flame for 45 min. or until tender. Add pepper strips for last 20-25 minutes of cooking. Add lemon just before serving - will discolor broccoli if added during cooking. Sprinkle vegetables with dill and serve.
Wash and break into sections. 2-3 tomatoes, sliced and cut into chunks. Stew for approximately 45 minutes (or until tender) on low heat.
Separate the Cauliflowerets and place in a baking dish with a little water and cook until soft at 250 degrees. When ready, drain off the water. At the same time, simmer the carrots on low heat with enough water until they are soft. Blend Carrots in blender with the oil. Pour sauce over the cooked Cauliflower, and place in warm oven (turned off) for 5-10 minutes, before serving.
Wash Carrots, cut off ends, and slice. Do not peel or scrape. Stew in a small amount of soup stock for 45 minutes or until tender. Last 5-10 min.
Cook onions and potatoes separately. In another pot, cook carrots and garlic. When done, puree each potfull separately, then mix together. Put chard leaves in very hot water, assuring not to overcook. Spread each leaf and remove tough center stem. Then place puree in center of leaf and roll tightly. Display on tray and serve with "ketchup" (see recipe, pg. 92).

Corn may be baked in the husk wrapped in foil. Bake in low oven for 1 hour or place in boiling water for approximately 7 minutes
Wash the corn well and husk it. Cut the kernels off. Slice the other vegetables into smaller pieces. Put the corn in a baking dish and add the vegetables. Bake in the oven at 200 degrees for 1 hour.
Husk corn and cut off the kernels. Put kernels from 2 ears in a blender and blend. Add the kernels from the third ear to the blended corn. Place in a baking dish and on the top place sliced green pepper. Bake in the oven 1 1/2 hours at 200-250 degrees.
Wash the corn well, husk, and cut off the kernels. Put this in a baking dish with a lid and bake in the oven at 250 degrees until done. Pour the corn juice off, and add the orange juice. Let set 5-10 minutes before serving.
Combine and bake in low oven in a covered casserole until tender. Stew approximately 1 hour, until tender. Do not add water

Put some soup stock in bottom of large covered baking dish
Cover and bake in low oven for 2 hours.
Stew approximately 30 minutes (until tender). Do not add water.
Eggplant RouladesDAIRY, PG. 98
To make the sauce, cook the pepper, onion, tomatoes and garlic in the water, and simmer for 20 minutes. Put through the food processor or blender. For the roulade, cut the eggplants lengthways into 1/4 slices. Put in an oven-proof dish and cook a little in the oven to soften them. In the meantime, mix together the cottage cheese and herbs and prepare the tomatoes. Then spread a little cottage cheese over each partially cooked piece of eggplant, scatter with tomatoes and roll up. Place back into the oven-proof dish and cook for 15-20 minutes. Serve hot, garnished with the pepper sauce.
Cut stalks and leaves off fennel. Slice bulb in half lengthwise so you have two flat halves. Rinse halves under running water to remove sand and put them in a baking dish with cut side up. Cover halves with tomato slices and place garlic slices on top of tomatoes. Cover dish and bake at 250 degrees for 1-2 hours. Serve with a baked potato and a salad of grated carrots on a bed of pretty greens.
Wash the vegetables well. Put the chard leaves in hot water long enough to wilt them so they will bend. Cut the other vegetables into small pieces, and put them in a pan with a little bit of water to boil on low heat. When cooked, drain the water off. Make a sauce in the blender with the tomatoes and garlic, and pour this sauce on top of the vegetables and raw rice. Place some of the vegetables-rice mixture in the center of each leaf and roll them up. Put these in a baking dish with a lid and bake in the oven for 1 to 1 1/2 hours at 250 degrees.

Stew in tightly covered pot approximately 30 min. (add no water)
Mix all ingredients except herbs. Simmer about 15 minutes (until tender) Thicken with cornstarch mixed with a little water. Just before serving add herbs.
Stew in tightly covered pot approximately 30 minutes.
Onions, Cheese MarinatedDAIRY, PG. 98
Put the pepper in a saucepan with a little water and cook over low heat (covered) until tender. Remove from the pan and leave the pepper upside down to drain and cool.
Finely chop the onion, zucchini, carrot, herbs, tomatoes, turnip and garlic. Place in a small saucepan with the soup and simmer over low heat for 45 minutes to an hour.
Core the pepper with a sharp knife, removing all seeds.
Mix the pot cheese with the cooked vegetables and fill the pepper using a small spoon.
Stand the pepper in a suitable baking dish and bake for 40 minutes at 350 degrees.
Serve with French Tomato Sauce, baked potato and a green vegetable.
Potatoes are most often boiled slowly in a covered pot over medium-low heat approximately 1 hour, until tender.
Baked potatoes should be thoroughly washed, not scraped or peeled. Bake in a low oven for 2-2 and 1/2 hours or bake 50 minutes to 1 hour at 350 degrees.
Peel and cube potatoes. Place in pan with one small onion and enough water to bring to a boil and simmer until done. When done, there should be no water left. Mash with enough non-fat yogurt to make smooth.
Take one bunch of chard, green or red, wash and shred and put in pan. Add small amount (4-5 Tbsp.) of water or soup stock, and start to boil. When boiling, turn down to simmer. Meantime, peel 3 large or four medium/large potatoes; cube and place on top of the chord. Let simmer until potatoes are soft and done.
Remove water if any remains, and add approximately 6-8 oz. of non-fat yogurt. Mash all together. Add a little more yogurt if the mixture is too dry. The same recipe can be used with kale. When using kale, remove central stems, by stripping them before shredding into pan.
Boil several potatoes in their skins until done. Remove the peel and roll in some chopped parsley after slightly brushing with flaxseed oil.
(marginal food, to be eaten only rarely)
Take a baking potato and cut it into thin (1/2") slices. Place the slices on the oven rack and, without any addition, bake at HIGH heat (425 F) to puff, turn over and lower heat to 325o F (with oven door cracked). Bake for another 20 minutes. The slices puff up and become crisp and tasty, almost like fried potatoes. Done when shiny brown on both sides.
Take a glass baking dish and place one whole chopped onion in bottom. Slice potatoes and place one layer on top of the onion. Then place a layer of sliced tomato on top, another layer of sliced or chopped onion. Sprinkle with a dash of marioram and/or thyme and bake in a low oven 1-2 hours or until done.
Potatoes and Carrots, Westphalian Style
Wash and slice carrots into pan. Peel and slice potatoes and chop onion. Add all together in pan with soup stock. Let simmer until done, adding a bit more Soup Stock if necessary. When done, no water should remain in pan.
Stew over low heat approximately 1/2 hour.
After cutting off roots wash 3-4 times. Put in large, tightly covered pot which has a layer of onions on the bottom of the pan. Do not add water. Stew over a low flame until spinach wilts. Pour off excess juice Serve chopped with slice of lemon
* I love the texture and taste of this. Japanese squash - it's very meaty and sweet, but you could use pumpkin, turban or acorn squash (cut latter in half and seed). You may also use 2 or 3 smaller sized squashes rather than a large one. This makes a very attractive presentation, especially if the squash are of different sizes.
Cook rice and wild rice together in vegetable stock for 45 minutes or until rice is done. Using stock to cook the grain adds both nutrition and flavor. Just save your vegetable trimmings, carrots, parsnips, chard stems or greens, celery, celery root, onion all work well. Avoid cabbage family veggies as they impart a strong flavor. Cover with pure water and simmer until done. Use in soups, to make sauces or what have you.
Carefully cut the top off of the squash as you would when carving a pumpkin. Remove seeds. Place squash face down on baking pan together with the squash lid and prebake for 25 to 30 minutes in a 350 degree oven. Take care not to over cook - a mushy squash cannot be stuffed.
Place onion and garlic, peas and celery in a pot and cook on low for 20 minutes to barely tenderize. Add diced pepper, raisins, herbs, citrus juice, and cooked rice, mixing well. Fill squash with stuffing, packing it down. Return to oven and bake 25 to 30 minutes, or until squash is tender, but still firm. If there is extra filling, bake in a covered casserole with a tablespoon of stock or juice, or fill a bell pepper or two and do the same.
To serve, arrange a platter with fresh kale or other leafy greens. Place squash in center of platter and artistically prop squash fid up against squash. Spoon out each helping, making sure to get some of the delicious squash meat. Alternatively, if squash is cooled a bit before serving, it may be sliced in wedges. Ladle Parsley Yogurt Sauce (see recipe below) over each portion, if dairy is allowed, otherwise a squeeze of orange juice adds a bit of zing. Enjoy!
Slice squash lengthwise and remove seeds. Combine remaining ingredients, fill squash halves. Cover and bake at 300 - 325 degrees F., for 1 1/2 hours, or until squash is tender. Delicious with Apricot Sauce or Golden Gravy (see Sauces & Dips).
Clean all vegetables, removing stem from snow peas, slicing white stalk and green leaf of bok choy into strips, slicing yellow squash lengthwise and then into half circles. You can make attractive planks out of the zucchini by trimming off each end, and then cutting in half, then half again. Stand each barrel of squash on end and slice down into 1/8" planks. Dice red onion, then slice carrots oriental style as thin as possible at a 45 degree angle into ovals. Slice leek in similar fashion across stalk into ovals. Put orange juice, honey, allspice, and vinegar into a blender, then pour into a suitable-sized steam pot. Cover with all the vegetables and simmer 15-20 minutes until tender. Very succulentt!
String Beans 1 lb. Green Beans (cut tips, wash and cut into any size piece desired)
Stew approximately 50 minutes (until tender)
Cut off tips and wash. Perforate with knife to let steam escape place in casserole (covered for soft skin, uncovered for crisp skin) bake in low ovenfor 2 to 2 and 1/2 hours.
Slice tomatoes in half. Put in pan, sliced side up, cover each half with chopped onions bake in low oven 1 hour. Save juice to put into soup
Put tomatoes through coarse chopper. Combine all ingredients except apples. Heat to tender about 30 min. stirring. Add chopped apples and cook until thick.
Tomatoes Stuffed with Mixed Vegetables
Vegetables: as much of as many kinds as desired
Wash tomatoes well. Hollow out the four tomatoes. Cut the vegetables into small pieces and boil in a little water for half an hour. Put cooked vegetables in the tomatoes and place them in a baking dish without the lid. In the blender, blend the two tomatoes and garlic. Spread sauce on top of each tomato. Preheat oven for ten minutes. Turn it off. Put tomatoes in for another ten minutes.

Stew for 20 minutes or cut squash into small pieces and place in a baking dish. In the blender blend the tomatoes, onion, and 4 garlic cloves. Pour sauce over squash and bake 1 & 1/2 hours at 200-250 degrees.
Wash the rice and vegetables well. Put rice in a baking dish and add chopped up parsley, carrot, celery, and zucchini squash. At the same time blend tomato and garlic in the blender and spread on top of the rice and vegetables. Bake in the oven for 1 & 1/2 hours at 250 degrees.
Saute onion, tomatoes and seasonings in a little water. Add zucchini when half done, and simmer. Serve as a vegetable or potato topping.
Wash one medium spaghetti squash and cut in half. Scoop out seeds and place cut side down on baking sheet. Bake in low oven for 2 hours or until tender. OR place cut side up in a large covered pot with 1" water and steam over low flame for 1 hour or until done.
Note. Spaghetti squash is a yellow hard winter squash developed by a Japanese farmer some 30 years ago. When cooked, it comes out in strands like spaghetti. It is now widely available especially in organic growers' circles.
Cook whole tomatoes over a low flame for 30-35 min. or until tender. To ensure a thick, rich sauce, pour off the extra juice drawn from the tomatoes during cooking.4 Put drained tomatoes through food mill or sieve to remove skins and seeds. Pour sauce back into pot and add remaining veggies and seasonings. Cover and stew over low flame for 1 hr. or until veggies are done to your liking. For a little extra bite add a dash or two of wine vinegar with 0 tsp. of honey.
Put lentils and eggplant (if used) through food grinder or Norwalk Juicer using grid #2. Mix with bread crumbs and remaining veggies. Mix well. Form into 2" balls and place on baking sheet well sprinkled with oat or rye meal to prevent sticking. Cover and bake in low oven for 1 hour. Uncover and bake 1 hour more.
Arrange cooked spaghetti squash on a plate with one or two beet balls, cover with sauce and enjoy!
Use 3 large white or 3 med. sweet potatoes in place of ground lentils. Boil until tender, then put through food mill or grinder with skins. Proceed as with above. Replace bread crumbs with 1/2 cup cooked brown rice or 1/3 cup oat flakes ground in Norwalk.
Grind in Norwalk or food grinder:
Bake in covered pan in low oven for approximately 2 hours. Uncover and baste with Golden Sauce or Tomato sauce. Bake another 30 minutes to 1 hour. Serve with extra sauce.
Veggie Stroganof*DAIRY, PG. 98
Stew vegetables for 1-1/2 hours until tender (you may want to add soft veggies like tomatoes and zucchini last). Set aside and let cool to 140 degrees while making sauce as follows:
Blend sauce until smooth. Mix with warm veggies. Serve over a bed of baked spaghetti squash or cooked brown rice. Garnish with chopped green onions or parsley.
Clean and dice all vegetables. Place in covered saucepan with water. Bring to boil. Lower heat. Cover. Simmer 2-3 hours. Mash through food mill.
Tomato Soup with Lemon & Garlic
Dice all vegetables. Place vegetables-soup stock-sugar and lemon in covered saucepan and cook for 1 hour. Mash through food mill. Replace in saucepan. Add oat flakes and cook 5 more minutes.
Chop tomatoes, slice spring onions, core and slice apple. Put these into a saucepan with the cider vinegar and sugar. Bring to a boil and simmer gently for 30 minutes. Put through food mill.
Either leave to cool, adding last ingredients later, or add the lemon juice and beat in the yogurt (if opted) immediately. Just before serving, add the chopped mint, leaving some scattered over the top of the soup for decoration.
Makes tour generous, or six small servings.
Tomato Soup with Potato & Onion
Wash and dice all vegetables. Place all ingredients except sugar in covered saucepan with water to cover. Cook over low flame for 1 hour. Mash through food mill and add sugar to taste.
Wash and drain apricots. Combine with water and soak for several hours. Add juice and stew over low flame until apricots are very tender, about 1 1/2 hours. Puree sauce in blender or by putting through Foley Food Mill or Norwalk.
Bake eggplant for one hour and when cool enough, peel and drain off excess liquid, squeezing gently. Blend with garlic until fairly smooth, add lemon juice and parsley. Mix well. Serve with raw dipping vegetables such as celery, carrots, cauliflower, peppers.
Combine ingredients and stew over low flame for 1 1/2 to 2 hours or until tender. Remove potato skins and puree.
Combine in a covered casserole:
Bake in low oven until tender (approx. 2 hours) Put through Foley food mill or spin in blender adding more juice to achieve desired consistency. Add 2 tsp. parsley and serve.
Place all ingredients in pan and bring to a boil. Cook until tender and put through food mill or liquefier until smooth.
Parsley Yogurt SauceDAIRY, PG.98
Cook onions over low heat until tender and translucent. Remove from heat and let cool slightly. Blend onions with horseradish, yogurt, citrus juice and sweetener in blender until smooth. Stir in parsley.
Wash plums. Remove pits and place in saucepan with water to half cover. Cook 15 minutes and strain through food mill. Add sugar, bread crumbs, lemon juice. Replace in saucepan. Cook 3 minutes longer. Serve over toast if desired.
Combine ingredients (don't overdo the lemon juice), cover and chill. Best eaten fresh but can be kept for up to 2 days in the refrigerator.
Place linseed oil in blender and start. Begin adding pieces of tomato and other ingredients a little bit at a time. Allow to whip for a minute or so until all ingredients are mixed. Yields about 2-3 cup of sauce.
Stew and let simmer for 1 hour and pass through Foley food mill. One can also add a little celery or green pepper for taste.
Cook chopped onion, carrot, celery tomatoes, parsley, garlic and bay leaf. Puree and serve hot or cold.

Most fresh fruits can be eaten when ripe unpeeled. Of course fruits like oranges and bananas should be peeled. Always wash fresh fruit.
Dried fruits should be washed in clean, lukewarm, distilled water and soaked over night in water (little more than to cover). Use the same water and cook in covered saucepan until tender. Dried fruits must be unsulfured.
The following fruit recipes are taken from Dr. Gerson's personal files.
Desserts should never replace the meals or juices of the therapy. At the risk of sounding like your mother, "Clean your plate before dessert, dear!" Do not eat or use as ingredients in desserts: ice-cream, fat, white flour, baking soda, candy, chocolate, cream, or salt. Have fun!
Use only brown (Sucanator raw sugar, light honey, maple syrup or unsulfured molasses.
Boil 1 lb. brown sugar in 1 quart of water and 1 cup apple juice until dissolved. Keep in covered jar.
Wash, core and cut apples in half. Place with raisins in pan or baking dish in oven for about 15 minutes until done then broil under flame until golden brown about 5 minutes. Apple halves should stay whole. Honey may be added to raisins - to taste.
Serve raw or place applesauce and banana in covered saucepan and heat slowly. Serve with lemon juice.
Apple Cake with Maple YogurtDAIRY, PG.98
Put peeled and chopped apples into a large bowl and sprinkle with lemon juice. Combine rolled oats, oatmeal, raisins, sugar, flour and baking powder and mix well. Stir this mixture into the apples. Pour mixture into cake pan and bake at 350 degrees F for 20-35 minutes or until lightly browned on top. Serve with yogurt mixed with 1-2 Tbsp. maple syrup.
Put apple slices in saucepan half covered with cold water. Boil until soft about 15 minutes. Put through food mill and mix with honey.
Run apples through the grinder portion of the juicer. Season to taste and enjoy.
Apple Spice Cake7
Combine wet and dry ingredients. Pour into non-stick oblong bake pan. Mix crumb topping and sprinkle on top. Bake at 325 degrees for 40 minutes or until cake tests done. Serve with a spoonful of fresh applesauce or non-fat yogurt. Enjoy.
Buzz oats briefly in blender to make a finer flake. Mix spices with oats. Mix in enough sweetener to make a crumbly mixture.
Combine dry ingredients. Coat apples. Drizzle on honey (if used) and juice. Fill pie crust. Sprinkle on topping. Bake at 300-325 F for 1 hr 15 min. or until apples are tender.
Place sweet potato slices in baking dish with apple slices and raisins spread with bread crumbs sugar and orange juice and bake in oven for 30 minutes. Serve hot with 3 tsp. buttermilk or yogurt if permitted.
Sprinkle yeast onto warm water into which I tablespoon crude brown sugar has been dissolved. Let stand for 5 to 10 minutes or until frothy. Warm buttermilk, yogurt or juice to 100o F. Add crude brown sugar and stir until dissolved. Stir buttermilk into yeast mix, then add oat flour and beat vigorously. Stir in enough of the remaining flour to make a stiff dough. Knead on a floured bread board, adding only enough flour to keep dough from sticking. Knead until smooth and elastic, approximately 5 to 10 minutes. Place in a bowl, cover with tea towel and let rise in a warm place until double in bulk, about 1 1/2 hours. Punch down and let rise again.
Divide dough in half. On floured board, press each part into a 15" x 9" rectangle. Place on separate non-stick bake sheets, or regular sheets that have been thoroughly coated with oat flakes to prevent sticking. Prick surface with fork, leaving 1/4" border around the edges. Cover and let rise until doubled, approximately 40 minutes.
Quarter, core and slice apples, arranging each sliced quarter over dough, as you cut it. Place the flat side down and the skin side up, fanning the slices out slightly. Leave about a 1/2" border. Mix maple and brown rice syrups. Using a pastry brush, coat the apples with the syrup. Combine date sugar and spices and sprinkle over apples. Bake at 325o F. for 30 minutes or until bread is lightly browned. Serve as is or with a spoonful of non-fat yogurt or yogurt cheese (see note below) lightly sweetened with honey or maple syrup.
Note: (Non-Gerson family members could enjoy this dessert with a scoop of non-fat fruit sweetened frozen yogurt - Cascadian Farm Vanilla (the milk is organic) or Stars Vanilla Bean are two brands I have enjoyed in moderation).
Cut apricots in halves and remove pits. Place in pot with boiling water and cook for 10 minutes. Add cornstarch during last 2 minutes. Add sugar when cool.
Cut banana in half lengthwise add 1 tsp. brown sugar and few drops lemon. Place in pan and broil under low flame for 10 minutes. Serve hot.
Mix banana and apple beating thoroughly with fork or egg beater. Add raisins and serve.
Chop banana and figs fine and mix well with orange juice. Fill orange peel with this mixture and serve.
Place cherries in saucepan with water to cover cook 10 minutes over low flame add potato starch dissolved in 2 tsp. cold water. Add to boiling cherries. Cook 2 minutes longer. Chill and serve.
Clean and wash currants thoroughly before removing stems. Place in dish add sugar and serve. Buttermilk or yogurt (if permitted) sweetened with brown sugar may be used for sauce.
Place fruit with water and sugar in saucepan. Boil gently slowly for 10 min. Add cornstarch. Cook 3 minutes longer. Cool and serve.
Cut ripe pears into halves, and core. Add about 4 oz. of water to honey or Sucanat and mix well. Place pear halves in baking dish and pour sugar mixture over fruit. Bake in slow oven (275 degrees F) until done. Baste with juice if necessary.
Spoon yogurt into a thin mesh strainer that has been lined with two layers of cheesecloth, and place it over a deep bowl. Let it drain into the bowl in the refrigerator for about 30 minutes. Spoon the drained yogurt into ice cube trays and freeze. Mix fruit and yogurt cubes into a food processor or the grinder of your K&K or Norwalk. The consistency is thick and smooth. Serve immediately.
Combine all the above ingredients in a baking dish. Put in the oven without a lid and bake for 45 minutes at 250 degrees.
Mix and let stand 10 minutes. Drop from teaspoon and bake in moderate oven about 20 minutes.
Pasha* (Uncooked Cheese Cake)DAIRY, PG. 98
Mix all ingredients. Pour batter into a strainer or colander lined with a clean cotton cloth (muslin). Cover with a plate to weight it down. Place in a bowl or pan and refrigerate for 5-10 hours or until dry and firm. Turn out onto a plate and slice. Good as is, or on a slice of Essene bread.
Wash peaches. Place in boiling water 1/2 minute, drain and peel. Cut in halves. Remove pits and place in saucepan with boiling water. Cover. Simmer for 10 minutes. Cool. Add sugar and serve chilled.
Place pears in saucepan with water to half cover. Add sugar and cook 30 min.
Wash plums, cut in halves and remove pits (Plums can also be cooked whole). Place in saucepan with water to cover. Cook 15 min. Remove, cool and add sugar. Serve chilled.
Soak prunes and apricots over night in water to cover. Use same water and boil with barley. Cool and serve.
Whip together thoroughly and put in refrigerator for 1 hour. May be served in slices decorated with sweetened yogurt (if permitted)
Pumpkin Pudding Pie* (Unbaked)
Soak tapioca and dates in juice overnight. In morning stew over low flame using a burner pad to diffuse heat. Cook for 30 minutes stirring frequently to prevent sticking. This will be very thick. Puree tapioca and pumpkin in Foley food mill or processor. Add spices and molasses. Pour into prepared pie crust and chill thoroughly (may put in freezer for several hours until very firm), otherwise cutting will be a problem. Serve with a dollop of honey sweetened yogurt cheese* if desired (and permitted by physician).
Use cooked squash, yams, or sweet potatoes in place of pumpkin.
Thin Buttermilk CrustDAIRY, PG. 98
Mix dry ingredients. Add honey and just enough liquid to make a stiff dough. Knead lightly to mix. Roll out on floured board or between layers of waxed paper. Carefully place in pie plate which has been thoroughly coated with oat flakes to prevent sticking. Trim excess dough and flute edges or make indentations with fork. Chill crust, then bake at 325 degrees for 10-15 minutes or until lightly browned.
Note: This will not be your traditional flaky crust, so roll out thin.
Sprinkle yeast into warm water mixed with honey. When frothy add flour and mix well. Let rise in a warm place for 1 hour. Knead on floured board for 5 min. Let rest for 10 min., roll out on floured board. Place in pie plate that has been thoroughly coated on the bottom with rolled oat flakes. Flute edge. Let rise far 15 min. Bake at 375 F. for 20-25 min.
Omit yeast, use just enough cold water to make a stiff dough. Roll out between sheets of floured wax paper. Carefully place in pie plate. Chill crust. Then bake at 350 F for 10-12 min.
Toast slices of bread in slow oven until lightly brown. Let cool. Grind coarsely by running through grinder or Norwalk. Add flour, then honey. Press into pie plate that has been well coated with rolled oat flakes. Chill for 1 hour. Bake at 350 F for 10-12 min. Roll, then fill.
Place washed rhubarb in saucepan. Simmer 15 to 20 minutes. Dissolve cornstarch in a little cold water. Add to rhubarb and allow to stew a few more minutes. Cool and add sugar, (note: combine rhubarb with other sweet fruits such as apples-peaches-apricots (fresh or dried).
note: Stewed fruits may be served on toasted rye bread placing a thick layer of fruit - allowing it to soak through for 1/2 hour before serving.
In a blender or food processor cantainer, combine one cup non-fat organic yogurt, 1/2 cup orange juice, 2 tablespoons honey, 1 cup cut-up fresh fruit and 1/2 cup crushed ice (made from distilled water); process until smooth.
Sweet Potato and Apple BakeGSG
Cook the sweet potatoes gently in their skins until tender. Allow to cool. Slice and put into baking dish with alternative layers of apple. Over each layer, sprinkle some water, a little sugar and some allspice. Bake covered for 20 minutes at 350 degrees F, then remove cover and bake for an additional 10 minutes.
Boil sweet potatoes (or yams) until done. Peel and mash with orange juice and apple sauce to make it a smooth, stuffing paste. Put stuffing into orange peel halves and put a dab of apple sauce on top. Can be reheated in a cake tray. Makes 4 servings. (Recipe may actually stuff 10 or more orange peels and may make more than 4 servings.)
Wash the rice and put into pot with the water. Once the water begins to boil, add the sugar and raisins and reduce the heat. Maintain on low heat until the rice is tender.

Dairy is temporarily forbidden in the beginning of therapy. Consult with your physician before adding any dairy to your diet.
After 6 to 12 weeks on the therapy, upon doctor's orders, animal proteins are cautiously added to the diet in the form of pot cheese, yogurt and cottage cheese, and churned (not cultured) buttermilk, all made from non-fat milk (preferably raw) and without salt.
When starting the proteins, it must be done slowly and carefully. Just one tablespoon at lunch and supper of the solid proteins and one-half cup of the buttermilk per meal. After 3-4 days, these levels can be increased until, at three weeks, one cup of solid dairy and one cup of yogurt or buttermilk per meal.
While adding the dairy proteins, the patient needs to watch for signs that the body is tolerating the new foods. Indigestion, flatulence (intestinal production of gas) and nasal mucus production are signs the enzyme activity cannot yet handle the dairy products. The patient should reduce or, after consulting the physician, eliminate the proteins for several more weeks.
Pour mixture into sterilized glass jar(s). Incubate between 110-115 F for 4-8 hours by one of the following methods:
Incubation time may vary, depending upon temperature. Ready when a toothpick inserted point first into the yogurt doesn't fall over. The yogurt becomes set a little more firmly after refrigeration. But this is a thin yogurt because it has no fat and processed dried milk added. Be sure to save 3 Tbsp. for the starter for the next batch.
Yogurt CheeseDAIRY, SEE HEADING
Yogurt cheese is made by hanging non-fat yogurt in a muslin sack over a sink or bowl or in a muslin lined strainer until it thickens to the consistency of cream cheese - without the fat - in about 6 to 8 hours.
Cottage Cheese Loaf*DAIRY, SEE HEADING
Combine all ingredients except the last two. Form into a loaf. Place on garnished platter. Top with decorative veggie slices, watercress or endive for garnish, slices of carrot, tomato, onion, green or red pepper for top.
Cottage CheeseDAIRY, SEE HEADING
Makes approx. 9 oz. (1 cup) cheese. Warm milk to body temperature (98-100 oF) by placing unopened bottle in sink of warm water. Incubate in warm place (near pilot light or in oven with light on). It is best to leave milk in original container to prevent airborne bacteria or molds from contaminating culture. The incubation period is about 24-30 hours. (Culture longer for a sharper cheese) Shake several times during this period.
When curd has formed, it will rise to the top. A harder curd can be formed by putting cheese (still in bottle) in sink of warm water and gradually increasing temperature to 110o for soft curd, and to 120o for farmer style cheese. Be careful not to overheat or you will destroy precious enzymes and beneficial bacteria. Use a thermometer to be safe.
Pour cheese into a strainer or colander lined with muslin or several layers of cheese cloth. Gather the corners of the cloth and press out whey. You may place a weight on top to speed the process.
For `cream' style cottage cheese add approx. 1/4 cup thick yogurt per cup of finished cheese.
For `herbed' cottage cheese, season with any of the following: fresh chives, crushed garlic, tarragon, parsley, dill weed, dill seed. Let set for 1/2 hr. before serving.
Add the juice of 1 or 2 lemons or 1/8 Cup yogurt to the fresh milk instead of letting it clabber naturally. These additions result in different flavors and textures. Experiment to find the one you like the best. Enjoy!
Cottage Cheese Sour Cream*DAIRY, SEE HEADING
Blend ingredients in blender. Add any or all of the following: Pressed garlic, grated horseradish, chives or green onion, fresh mint or dried dill weed. Use to top baked potatoes or as dip for veggies.

Bread can be used as a snack, after breakfast, or with a meal if the patient has a good appetite. Do not replace potatoes and vegetables with bread.
Sourdough is sour fermented dough used as leaven. Don't be put off by the name - sourdough breads don't taste sour. They have a tangy flavor. Sourdough is a white substance over which a colorless or gray liquor called hooch collects. Hooch enables sourdough to complete its fermentation. You have to feed sourdough and keep it in the refrigerator because it is a living thing - full of microorganisms. Colonies of these microorganisms can live for many decades with proper care and feeding. You can use a starter batch obtained from someone else to get your own going or buy a dehydrated starter or make it from scratch. There are many different kinds of sourdough starters: white - yogurt - whole wheat - sour rye - etc. For patients on the Gerson Therapy Rye Sourdough is the recommended variety.
Put 1 cup sourdough in mixing bowl. Add 2 and 1/2 cups flour and 2 cups warm water. (this is known as feeding.) Mix thoroughly. Leave an counter for 8 hours or overnight. Be sure to replace 1 c sourdough in the jar in the refrigerator. Try to feed sourdough once a week or every 10 days. Feeding is necessary to keep it alive and may add tang to the flavor (note: sourdough can be frozen).
General Rules Pertaining to Sourdough
Mix sourdough in water, add flour. Leave covered and warm (180 degrees) for 12-24 hours. Replace 1 cup sourdough to refrigerator as starter for next time.
Roll and cut dough to fit loaf pans, smooth the surface with a wet hand and leave in a warm place to rise for 2-5 hours. The taste gets stronger the longer it is left to rise and it will rise only a little. Cut a furrow down the middle and this should be about 1/4 to 1/2 inch deep.
Bake for 1 and 1/2 hours at 385 degrees. Take out of pans immediately and wrap in towels and turn upside down. Do not cut for about 12 hours, bread can be frozen when lukewarm.
1 slice of bread, spread with cottage cheese, topped with tomatoes, and radishes or sprouts or 1 slice of bread topped with honey.
Place in an uncovered casserole and bake in low oven 2 hours.
Toast leftover bread in the oven. Run through the food grinder. Store in covered container in the refrigerator.
Sour Rye Bread (Black Bread Russian Style)
Note; Sour Rye is a different sourdough culture. You will need to make the sour rye sourdough starter from scratch and keep it separate from your other starter.
Mix seven cups of the rye flour with water and sourdough culture. Cover and let stand in a warm place 12 to 18 hours. (Remove and save 1/2 cup of dough as a culture for next baking. Keep the culture in a tightly closed jar in refrigerator.) Add remaining cup of rye flour and mix well. Divide dough in half. Form oblong loaf smaller than size of pan in lightly floured hands (using rye flour).
Place gently into stainless steel baking pans. Do not press: allow space around sides of loaf.
Try dusting stainless steel pan with flour or rye meal, no oil. Let rise for approximately one half-hour. Bake at 350 degrees F. for one hour or more. Makes 2 two-pound loaves. Store tightly wrapped in refrigerator.
In wide mouthed glass jar at least one quart in size Mix well the following ingredients:
Stir well once daily with a wooden spoon (never leave a metal spoon in starter).* Allow to sit for 3 to 5 days until sour odor is detected*. May cover. LOOSELY after 2nd day remove one-half cup for bread recipe above* Store covered in refrigerator adding half cup from dough after first rising. Bring to room temperature one hour before starting each new recipe
Mix ingredients in large non-metal bowl. Cover and let stand in warm place for several hours (or overnight for a very sour loaf). Add the following:
1-1/2 to 3 cup Rye Flour as needed to make a workable dough.
Turn on to floured board and knead for 5-10 minutes. Let dough rest for 5 minutes, then form into round or baton shaped loaves. Place on Teflon or regular bake sheet (ungreased) that has been well coated with raw oat flakes to prevent sticking. Let bread rise until almost double (when bread does not spring back when lightly touched). Bake at 350 degrees for 50 minutes to 1 hour. For a very chewy crust, place a pan of water in bottom of oven to create steam, or baste bread several times during baking with water. For soft crust, do not steam or baste. Immediately wrap loaves in cotton towels upon leaving oven. Let bread cool before cutting.
Mix dry ingredients in ceramic or plastic bowl. Cover and let stand in warm place to proof (85 to 95 is ideal.) Add 2 cups rye flour, then 1 1/2 to 3 cups more rye flour until achieving workable dough. Turn into floured board and knead for 5-10 minutes. Let dough rest for 5 minutes, then shape into loaves or rolls. Sprinkle bottom of baking pans with raw oats, then let rise for 2 hours or until doubled in size. Bake at 350 for an hour. Let loaves cool before slicing.
Sift dry ingredients together. Stir in raisins. Mix the remaining ingredients, then gradually stir into dry mix. Dough should be rather firm. Divide in half and fill two non-stick bake pans. Bake at 325 degrees for 50 minutes or until toothpick comes out clean. Let cool before removing from pan.
This naturally sweet cakey bread is made with only sprouted grain. The original recipe comes from The Essene Gospel of Peace, a 2,000 year old Aramaic text, which reveals the process of sprouting wheat as follows:
"Moisten your wheat, that the angel of water may enter it. Then set it in the air, that the angel of air may also embrace it. And leave it from morning to evening beneath the sun, that the angel of sunshine may descend upon it."
This modern version differs from the original only in the use of oven heat instead of the sun's.
For one loaf use: 1 quart of 2 day old wheat, rye, or triticale sprouts.
Refrigerate sprouts for one day, uncovered, to dry slightly. Do not rinse before grinding or you will wind up with more of a pudding than bread. Grind in hand or electric grinder or in the Norwalk using the #2 grid (second to the largest). Feed sprouts gradually or they will set up like cement in your grinding mechanism.
Shape into 1 1/2" to 2" high loaf. Place on non-stick or regular baking sheet well coated with oat flakes to prevent sticking. Bake at 250-300 degrees for 1 1/2 to 2 1/2 hours (loaf should be nicely browned). Cool thoroughly before slicing (chilled is best).
Use serrated knife with a gently sawing motion. It also helps to dip knife in cold water before slicing bread.
Form into 1/4" patties or roll out on floured board and cut into squares. Bake on non-stick or oat coated baking sheet at 250-300 degrees for 45 min. to 1 hour.
Dr. Gerson's book, A Cancer Therapy - Results of 50 Cases does not mention chemotherapy anywhere. The reason is that during the time he practiced, chemo was just being researched and rarely used. An exception is the case of Johnny Gunther (Appendix II, p. 415) who had been treated with one of the first experimental drugs. At the time of Johnny's death, Dr. Gerson was devastated because he truly loved the boy. He took the blame for his death and felt it was due to the hormone treatment he had permitted to be used. As we have found out in the meantime, the hormones could have contributed to the damage; but the boy exhibited what we now recognize as a typical "6th month chemo flare-up". Since this was the very first chemo case Dr. Gerson was treating, he didn't realize the specific changes that take place under those circumstances.
In our 22 years of experience using the Gerson Therapy under present conditions, we have understandably run across a fair percentage of patients pre-treated with now dozens of different "cytotoxic" (tissue-poisoning) drugs.
The first chemo-treated patients that were accepted for treatment at the Mexican Gerson Hospital at approximately the same time were suffering from breast cancer. It was assumed that it would be wise to `detoxify' these patients as thoroughly as possible to remove the administered poisons. Therefore the physicians administered the castor oil treatment (commonly used in Gerson patients) to those patients as well. The shock came when the physicians observed that the castor oil tended to remove those toxins too rapidly releasing them into the blood stream and actually causing these patients to suffer from an overdose of chemo. These 2 patients had to be transferred to intensive care! In other words, it became evident that chemo-treated patients must be treated cautiously and detoxified slowly.
In the meantime, we have seen many such patients and a number of satisfactory long term recoveries have been recorded. (See one case in the Gerson Healing Newsletter, May/June 1999; Vol. 14, #3).
We give below the suggested modifications of the basic Gerson Therapy as described in A Cancer Therapy: Results of Fifty Cases, by Dr. Max Gerson. Naturally, the exact treatment, number of juices, enemas, medications etc. are adjusted by a Gerson trained physician; but this is the basic daily protocol.
Basic Daily Protocol for the Modified Therapy:
Caster Oil Enemas are Omitted from the Modified Therapy!
It has frequently occurred to me that, in order to really be sure that the patients understand and follow the Gerson Therapy exactly, I ought to follow them around their house and kitchen for 24 hours. The situation that occurred last week-end amply illustrates the point. I was surprised and shocked because I certainly didn't expect to find the following situation. But since it was taking place I feel that I need to share my concerns with our friends and other patients in order to make them aware and prevent errors.
The patient in question was not only very much interested in the Gerson Therapy for his own recovery but he feels so strongly about spreading the word of healing that he organized a Gerson Convention Day. He also invited me to stay at his lovely home overnight so that I could be spoiled with good, organic Gerson food and juices.
The house is located in a wooded area, with beautiful huge trees, and at the edge of a small lake. In other words, the air is clean and fresh and the atmosphere relaxing - no problem there. The patient's business is well organized and runs quite well with minimal attention, so he is able to get a lot of rest. There is help in the household, so there are no pressures in the juice and food preparation. But there are at least four major problems in the patient's application of the Therapy:
1. The water is `hard'; it contains minerals. So, like other people in the area, the patient's home is equipped with "water softener" equipment. His very warm, concerned and cooperative wife is doing everything in her power to help her husband recover. Yet she stated that she brings in "sacks of salt" for the water softener! As our readers know, in the process of removing the unwelcome minerals in the water, the equipment replaces these with sodium. What happens as a result is that the patient washes and bathes in "softened water", loaded with salt. Salt is very easily absorbed through the skin and should never be used by a Gerson patient. Salt is an enzyme inhibitor and the Gerson Therapy is designed to remove all excess of sodium. Salt is needed for fast growth of tumor tissue. It is also the basis of the "tissue damage syndrome", when normal cells lose their ability to hold potassium while sodium penetrates, causing edema and loss of function. This tissue damage is, according to Dr. Gerson, the beginning of all chronic disease. Naturally, bathing in salt water must be avoided at all cost.
2. We were served a very delicious and attractive lunch which included a lovely salad loaded with avocados. I immediately asked if the patient, too, was eating them. He was! That is another serious mistake, since avocados contain a fairly large percentage of fat. This is the reason why they are forbidden, because fats tend to stimulate new tumor growth! The lady of the house said that she thought that avocados were served at Meridien - which they are not. The problem here is that the patient or caregiver should not rely on memory. All these items are clearly set down in the A Cancer Therapy; and avocados are the second item on the Forbidden list. We have to ask patients and caregivers to read and re-read the "Therapy" Chapter in the book, Chapter XXXIII, p. 237, and make sure that they understand all the directions exactly and follow all instructions.
3. Along with the lunch, we had a very nice vegetable soup. It contained some zucchini, peas, celery and onions and a few other vegetables. The patient asked me how I enjoyed the "Hippocrates Soup". I had to state that the soup we had was not Hippocrates soup, as Dr. Gerson describes it in the book. The combination of ingredients that are supposed to be in that soup are clearly described in the book as well as in this book, the Gerson Therapy Handbook and are very specific. Actually, Hippocrates (the father of medicine) already understood that this special combination of ingredients has a beneficial, detoxifying effect on the kidneys. That is the reason why Dr. Gerson used it. He felt that this soup was so important that he wanted patients to eat this `special soup' twice daily to benefic the kidneys and help them to clear toxins from the body. Occasionally, one can add some extra tomatoes, in season, to give the soup a different flavor; or one can cut up and roast some onions on a dry cookie sheet (NO fat, butter or oil) in the oven. Then these can be added to the same basic soup recipe for a taste treat. However, the basic recipe remains unchanged.
4. The lady of the house also thoughtfully offered me some enema coffee which I gladly accepted. When I picked it up for use, however, I seriously wondered whether it was the proper strength. I have used enemas for many years and know pretty well what the coffee should look like. This solution seemed too weak to be considered, "concentrate" for dilution 4 to 1. The lady `thought' that she used the recipe in the Handbook and that it was right. The caregiver must be sure that each enema contains the equivalent of 3 rounded tablespoons of coffee (See A Cancer Therapy, p.247). If a concentrate is prepared, each portion MUST contain the 3 tablespoons of coffee. The coffee enema, too, is so very important that it is imperative that the mixture or solution is correct. Please check and recheck the preparation of the coffee concentrate.
5. Somewhat less important than the above 4 points: The patient enjoys some bread with his meals - which is quite acceptable. But it is also important to understand that the main needs for nutrition are the salads, soup, potato and vegetables, and fruit. If all those foods have been consumed, it is alright for the patient to also have a slice of unsalted rye bread. Bread should never be the main part of a meal.
Unfortunately, in the last few months, we have had several patients who failed. I also discussed this problem with the most experienced Gerson Therapy doctors: Alicia Melendez and Luz Maria Bravo. Aside from the above, there are other problems we have run across. Let me state here that we (the Gerson doctors as well as myself when I talk to patients) have a serious problem. When we ask the patient about their compliance with the Gerson Therapy directives, even the above patient Who made serious errors, will assure us that he is doing everything `perfectly'. These patients don't realize what is wrong with their version of the Therapy.
When we try to help, heal, and direct the patient to the Gerson Therapy, we rely on the various tools that we have specially created to give the patient and family every possible help and guidance: the food preparation video-tape and the recipe book in the Handbook; the 4-hour workshop tape discussing in detail as much of the treatment as we can and, most important, Dr. Gerson's book. At this point, I need to stress again that the patient must familiarize himself very thoroughly with this material and review it over and over again.
One problem area that keeps coming up is the food preparation. Just boiling the food and putting it on the plate is not good enough. The food preparation tape initiates the cook into various areas to make foods tasty. For example, cooked beets When pealed and sliced can be reheated a little with some freshly made apple sauce, stirred, and the vegetable then resembles "Harvard beets". Or, the sliced beets can be dressed with onions, some green pepper strips and vinegar with flax-seed oil dressing for a beet salad. During the summer months, these salads (also potato salad, string bean or butter bean salad, etc.) are very welcome, refreshing and appetite stimulators. There are many suggested recipes in the back of the Handbook that, I am afraid, are being disregarded. As a result, we get the report that the patient is weak, is losing weight, and is doing poorly. Almost always, it turns out that they have `cravings' for pizza, enchilada, or some other greasy, salty, forbidden food. They are simply hungry because they are not eating the healing, nutritious Gerson meals which are not well prepared.
The Gerson food has another advantage: if the patient (or family member for that matter) eats fresh, organic food, it is truly satisfying and we often get reports that the companions lose their cravings for sweets or heavy desserts. But the key is tasty food that is prepared with imagination and inspiration from the recipes provided. I must remind, patients frequently that when they are on a nutritional therapy, they are on nothing if they don't eat! If patients eat properly, we have seen most gain weight if they are emaciated. Some who are too heavy will lose weight on the same regimen.
The summer fruit are especially valuable, high in potassium enzymes and the best nutrients: cherries, apricots, peaches, nectarines, plums, pears, grapes and more. But not far behind are apples that are available virtually all year round. Patients (unless they are diabetic or suffer from Candida) should always eat much fruit at night, first thing in the morning, and anytime between meals. One summer food presents a problem: corn. It is perfectly alright to eat corn. The difficulty is that everybody loves corn and during the season is likely to eat it to the exclusion of other vegetables. That is a very bad idea. The vegetables should provide variety and a large selection of special healing chemicals (phytochemicals) and trace minerals. Eating mostly one vegetable is not acceptable and does not fulfill the purpose.
Let the guiding spirit of the patient be: "I'll do the best possible to help my sick body heal" rather than "I'll see how little I can do and still get away with it".