Print Files: A4 Size (pdf), Text (txt).
Insights into the history of the inner solar system can be derived from the impact cratering record of the Moon, Mars, Venus, and Mercury and from the size distributions of asteroid populations. Old craters from a unique period of heavy bombardment that ended ∼3.8 billion years ago were made by asteroids that were dynamically ejected from the main asteroid belt, possibly due to the orbital migration of the giant planets. The impactors of the past ∼3.8 billion years have a size distribution quite different from that of the main belt asteroids but very similar to that of near-Earth asteroids.
The Moon and all the terrestrial planets were resurfaced during a period of intense impact cratering that occurred between the time of their accretion, ∼4.5 billion years ago (Ga), and ∼3.85 Ga. The lunar cratering record and the radiometrically dated Apollo samples have shown that the intense bombardment of the Moon ended at ∼3.85 Ga; the impact flux since that time has been at least an order of magnitude smaller. The 3.85-Ga epoch might represent the final end of an era of steadily declining large impacts (the tail end of the accretion of the planets). However, it has also been argued that only a sudden injection of impacting objects into the terrestrial planet zone could account for the abrupt end of the intense bombardment; thus, this event has been named the Late Heavy Bombardment (LHB), or sometimes the Lunar Cataclysm, to distinguish it from the prior final accretion of the planets at 4.5 Ga. Specifically, the lunar cataclysm hypothesis [1]-[3] postulates that the intense bombardment of the Moon lasted only a very short period of time, 20 to 200 million years (My) [2]-[6]. Recent results on the impact ages of lunar meteorites (which represent a much broader region of the lunar surface than the Apollo samples) support this hypothesis [7]-[9]. Furthermore, the impact-reset ages of meteoritic samples of asteroids [10],[11] and the metamorphosing by impact shock effects at 3.92 Ga of the only known sample of the heavily cratered highlands of Mars, meteorite Allan Hills 84001 [12], indicate that the LHB affected the entire inner solar system, not just the Moon.
Identifying the sources of planetary impactors has proven elusive. Dynamical models invoking both geocentric and heliocentric debris and both asteroidal and cometary reservoirs have been proposed [13], but chemical analyses of Apollo samples of impact melts point to a dominantly asteroid reservoir for the lunar cataclysm [11]. Here we provide evidence that the source of the LHB impactors was the main asteroid belt and that the dynamical mechanism that caused the LHB was unique in the history of the solar system and distinct from the processes that produce the flux of objects currently hitting planetary surfaces.
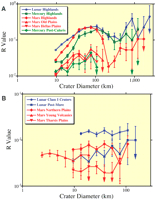
We examined the crater size distributions [14] of surfaces of various ages on the Moon, Mars, and Mercury, using published data [15],[16] supplemented by new crater counts (table S1). Of the terrestrial planets, only the Moon, Mercury, and Mars have heavily cratered surfaces. These surfaces all have complex crater size distributions (Fig. 1A). The curves for Mercury and Mars are steeper than the lunar curve at diameters less than ∼40 km, because plains formation has obliterated a fraction of the smaller craters (fig. S1). Therefore, the lunar highlands curve best represents the shape of what we shall call the Population 1 crater size distribution.
The crater size distributions on the Moon, Mars, and Mercury, shown as R plots [14]. (A) The curves for heavily cratered surfaces on the Moon (blue), Mars (red), and Mercury (green). (B) The curves for younger surfaces on the Moon (blue) and Mars (red). The size distributions on younger surfaces (Population 2) are different from those for the old surfaces that represent the LHB (Population 1). The arrowheads represent lower limits of errors that are below the abscissa.
The crater curves for martian old plains east of the Tharsis region, old plains within the Hellas basin on Mars, and plains within and surrounding the Caloris basin on Mercury have the same shape as the lunar highland curve over the same diameter range but with a lower crater density [17]. The lower crater densities imply that these older plains probably formed near the tail end of the LHB, ∼3.8 Ga. For the younger surfaces, the crater size distribution curves are flat and distinctly different (Fig. 1B). These include the lightly cratered (and hence younger) plains on Mars and the Moon, as well as fresh craters with well-defined ejecta blankets (Class 1 craters) on the Moon. This crater population we call Population 2.
The crater density on Venus (Fig. 2) is about an order of magnitude less than on Mars. Only young craters are present, evidently because older craters have been erased by multiple global resurfacing events [18]. Furthermore, small craters are scarce on Venus because its thick atmosphere screens out small impactors [19]. Part of the Venus crater population consists of clusters of craters (multiples) that result from fragmentation of the impacting object in the dense atmosphere. These comprise 16% of all Venus craters (table S1). The size distribution of these multiples is also shown in Fig. 2, where the diameter is derived from the sum of the crater areas in the cluster. The turnover of the curve for multiple craters does not occur until diameters less than 9 km; at larger diameters, the curve is flat. This, together with the much lower crater density, strongly suggests that the impacting population on Venus was the same as Population 2 on the Moon and Mars. It is also evidence that the turnover of the crater curve is indeed due to atmospheric screening.
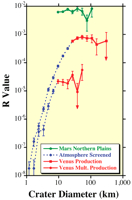
Size distributions of all Venus craters and, separately, multiple craters, compared to craters on the Mars Northern Plains (green). The downturn in the Venus curves (dotted blue lines) is due to atmospheric screening of projectiles. The unscreened portions (red) are the same as Population 2 on Mars.
The two characteristic shapes of the crater curves in the inner solar system are summarized in Fig. 3. We conclude that the terrestrial planets have been impacted by two populations of objects that are distinguishable by their size distributions. Population 1 is responsible for the LHB, and Population 2 is responsible for impacts since the LHB period.
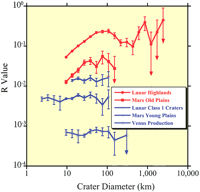
These crater curves summarize the inner solar system cratering record, with two distinctly different size distributions. The red curves are Population 1 craters that represent the LHB period. The lower density blue curves (Population 2) represent the post-LHB era on the Moon, Mars, and Venus. The Mars young plains curve is a combination of the Mars Northern Plains and Mars young volcanics. The Venus curve is a composite of the production population for all craters greater than 9 km, including multiples in the range of 9- to 25-km diameter.
A number of studies on the physics of impact cratering on solid bodies have derived projectile-crater scaling laws. We used the Pi scaling law [20]-[22] to derive the projectile size distribution for Population 1 and Population 2 impactors. We used the lunar highland crater curves as representative of Population 1 and the martian young plains as representative of Population 2, as these provide the best statistics. (We did not include crater diameters greater than 500 km, because of scaling uncertainties.) We assumed projectile parameters appropriate for asteroidal impacts: a density of 3 g cm−3 (similar to basaltic rock), an impact angle of 45o, and impact velocities of 17 km s−1 and 12 km s−1 on the Moon and on Mars, respectively [23]. We compared these distributions (Fig. 4) to recent determinations of the size distributions of the main belt asteroids (MBAs) [24]-[27] and near-Earth asteroids (NEAs) [28]. The size distribution of the current MBAs is virtually identical to the Population 1 projectile size distribution, as pointed out by Neukum et al. [29]. This result indicates that the objects responsible for the LHB originated from MBAs. Unless comets or Kuiper belt objects have the same size distribution, these objects could not have been major contributors to the LHB.
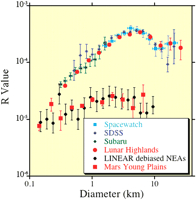
The size distributions of the projectiles (derived from the crater size distributions), compared with those of the MBAs and NEAs. The red dots (upper curve) are for the lunar highlands (Population 1), and the red squares (lower curve) are for the Mars young plains (Population 2). The other colors and point styles are for the asteroids derived by various authors: In the upper curves, the light blue, the dark blue, and the green symbols are from Spacewatch [24], the Sloan Digital Sky Survey [25], and the Subaru asteroid surveys [26], respectively; the black dots in the lower curves are the debiased LINEAR NEAs [28]. An arbitrary normalization factor was applied to obtain the R values for the asteroids. The MBA size distribution is virtually identical with Population 1 projectiles responsible for the LHB crater record. The NEA size distribution is the same as Population 2 projectiles responsible for the post-LHB crater record.
The close match between the current MBA size distribution and that of the LHB projectiles implies that the main asteroid belt has remained unchanged in its size distribution over the past 3.8 Gy. There are two possible interpretations of this result: Either collisional processes produced a steady-state size distribution in the main asteroid belt at least as early as 3.8 Ga, or the collision frequency in the main asteroid belt was drastically reduced around 3.8 Ga.
The mechanism responsible for ejecting asteroids from the main asteroid belt and into terrestrial planet-crossing orbits during the LHB had to be unique to the early solar system, because there is no evidence for any event of similar magnitude in the inner planets' cratering history since then. Furthermore, that mechanism had to be one that ejected asteroids from the main belt in a size-independent manner, preserving the MBA size distribution in the inner planet impactor population. This precludes size-dependent nongravitational transport processes, such as the Yarkovsky effect, and instead implicates a dynamical process, such as sweeping gravitational resonances, that is largely insensitive to asteroid mass.
A dynamical mechanism involving the orbital migration of the giant planets is consistent with the above constraints and explains the congruence of the size distributions of the MBAs and the Population 1 projectiles. Such migration of the outer planets is thought to have occurred on a time scale of about 107 to 108 years early in solar system history [30]-[33], and it would have caused severe depletion of asteroids because of orbital instabilities that ensued as strong gravitational resonances swept across the asteroid belt [34]. This phenomenon would have caused the Moon and terrestrial planets to be cataclysmically bombarded by asteroids and icy planetesimals (comets) for a period of 10 to 100 My [35]. A recently proposed variation on the giant planet migration theory invokes the change in the eccentricities of Jupiter and Saturn, if and when these planets passed through a 1:2 orbital resonance during their orbital migration [36]. Such a resonance passage would have destabilized the planetesimal disk beyond the orbits of the planets, causing a sudden massive delivery of comets to the inner solar system. In this scenario, the asteroid belt is also destabilized because of sweeping gravitational resonances; together, these cause a major spike in the intensity of cometary as well as asteroid impacts on the inner planets [37].
In either scenario, the relative intensity of comets versus asteroids in the projectile population of the LHB is not well determined by the published dynamical simulations. Because the impact signature in the crater record in the inner solar system is asteroidal, we conclude that either comets played a minor role or their impact record was erased by later-impacting asteroids.
Both of these mechanisms predict a LHB lasting between ∼10 My and ∼150 My. Therefore, the LHB was a catastrophic event that occurred from ∼3.9 Ga to 3.8 Ga. Because of this, it is not possible to use the crater record to date surfaces older than ∼3.9 Gy; the previous crater record has been obliterated by this event. The heavily cratered highlands of the Moon, Mars, and Mercury that register Population 1 impacts were resurfaced 3.9 Ga, although older rock relics may have survived.
The size distribution of Population 2 projectiles (Fig. 4) is the same as that of the NEAs and quite different from that of the LHB projectiles. Thus, NEAs are largely responsible for the cratering record after 3.8 Ga. This result is contrary to previous findings [38] that may have been based on data uncorrected for observational biases (cf. 28) and analysis, based on cumulative (rather than differential) size distributions, that was not sufficiently sensitive to the differences in the distributions.
A plausible reason that the MBAs and the NEAs have such different size distributions is the Yarkovsky effect, which causes secular changes in the orbital energy of an asteroid because of the asymmetric way a spinning asteroid absorbs and reradiates solar energy [39]. Over a few tens of millions of years, the effect is large enough to transport a substantial number of asteroids smaller than 20 km in diameter into strong Jovian resonances [40] that deliver them into terrestrial planet-crossing orbits. The magnitude of the effect depends on the size of the asteroid: For diameters greater than about 10 m, the smaller the asteroid, the larger the effect. This explains why the NEAs (Population 2 projectiles) have relatively more small objects compared to the MBAs. Because the younger post-LHB surfaces have been impacted primarily by NEAs, the ages of these surfaces can be derived from the crater production rate of NEAs. However, the ages derived from the NEA impacts will be an upper limit, because we do not know the comet crater production rate with any certainty.
Our results further imply that dating surfaces of solid bodies in the outer solar system using the inner planet cratering record is not valid. Attempts have been made to date outer planet surfaces on an absolute time scale by assuming that the crater population found in the inner solar system is the same throughout the entire solar system and has the same origin. In light of our results, this assumption is false. Additional evidence to support this conclusion is found in the cratering record of the Jovian satellites. Indeed, Callisto has a crater size distribution different from both Population 1 and Population 2 craters [41],[42].